On the night of Aug 04/05, 2005 EDT, Tracy Davis and I used the RIT Observatory's 12-inch Meade telescope and SBIG ST8 CCD camera to monitor the cataclysmic variable star HS 1813+61. This target of the Center for Backyard Astrophysics has a period of about 203 minutes; see Jochen Pietz' analysis of earlier observations of HS 1813+61 for more details.
The plan:
Notes from the night
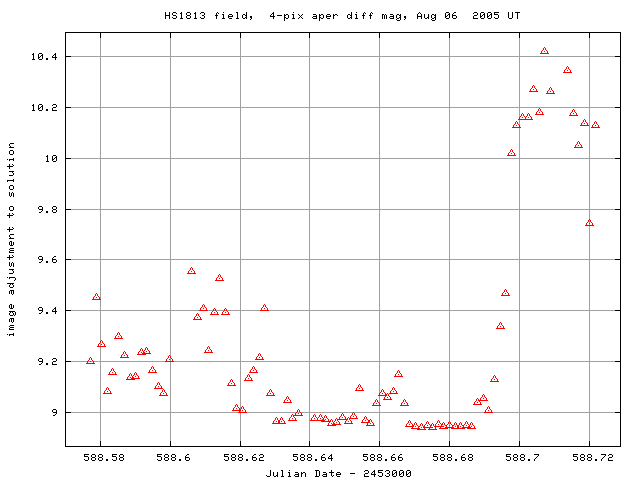
You can see how thick the clouds are by looking at this plot of the adjustment in magnitudes which had to be added to each frame to make it match the ensemble for the night.
Note the jump by about 1.4 magnitudes around time 588.69! The table of measurements shown below was cut off around time 588.695, when the clouds really became thick.
This is a chart of the field based on images taken on earlier nights. Click on the chart for a larger version.

The best photometry I could find for the stars in this field is simply the USNO B1.0 -- oh, well. The star marked "B" in the chart above is USNO B1.0 1514-0236071. Based on the USNO B1.0 "B" and "R" magnitudes, I calculate a very very rough "V" magnitude via the simple average "V" = (B+R)/2 = 13.77. I'll use that to set the zeropoint of the differential unfiltered measurements; not good, but all I can do for now. I hope someone does good photometry of field stars on the standard scale ...
The star marked "X" on the chart above is USNO-B1.0 1514-0236034. It showed strongs hints of variability during other nights, but tonight was steady within the noise -- see the figures below.
I measured the instrumental magnitude of each star with aperture photometry, using a radius of 4 pixels = 7.5 arcseconds and sky defined by an annulus around each star. Following the procedures outlined by Kent Honeycutt's article on inhomogeneous ensemble photometry, I used all stars available in each image to define a reference frame, and measured each star against this frame.
Below is a graph of the scatter in differential magnitude versus magnitude.
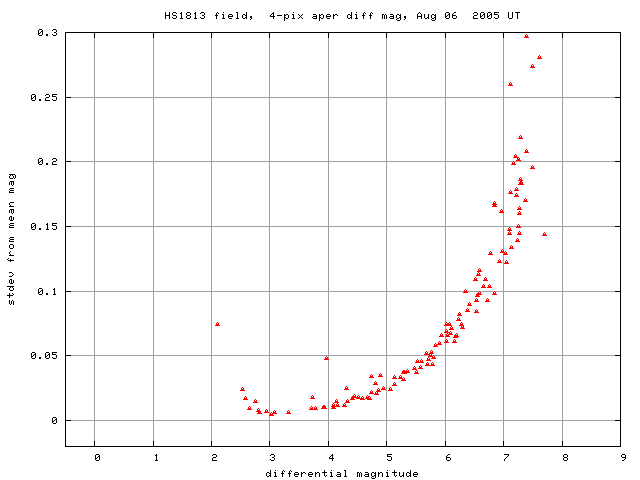
HS 1813+61 is the star near differential mag 4.0, with an elevated scatter. The outliers at the bright end are stars which were saturated; some appear not be saturated in a spot check of a few images, so I'm not sure exactly why they show such large scatter ... I removed them from the ensemble solution.
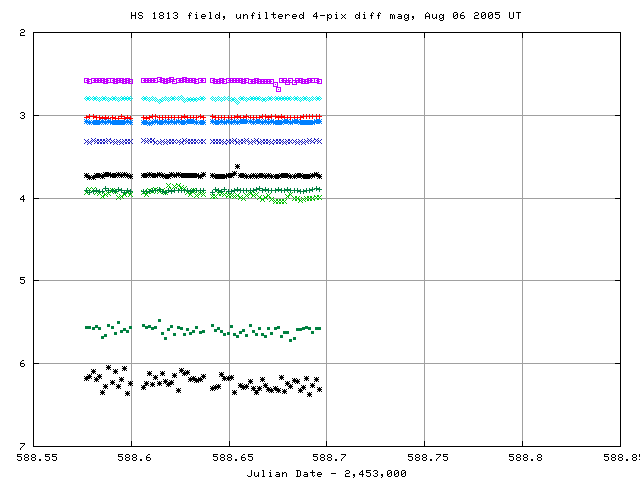
Light curves for selected stars in the field are shown below. HS 1813+61, shown by light green crosses near the middle, is clearly variable. The black points around differential magnitude 6 are measurements of the star "X". It doesn't show any significant change outside the (large) scatter.
Here's a closeup of the variation in HS 1813+61 itself:
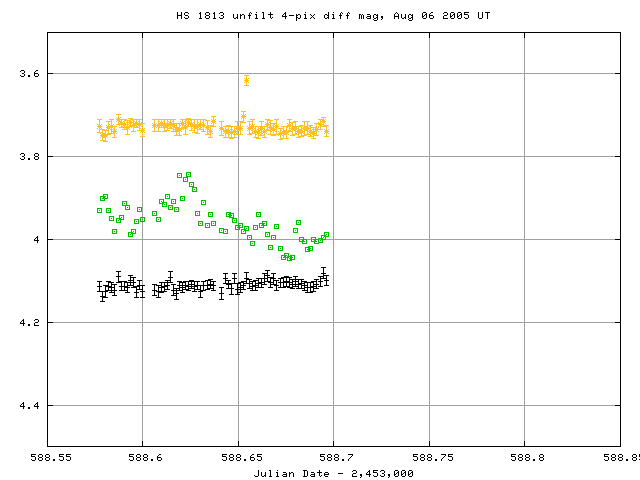
The large scatter hides any fine detail (especially near the ends of the observing run), but there is clearly some slow, rolling variation.
I've made a table of the measurements themselves, with three different flavors of time. The differential unfiltered magnitudes from the ensemble solution has been shifted so that star "B" in my chart, has value 13.77, matching a very rough guess at its V-band magnitude, based on B and R mags in the USNO B1.0 catalog.
Here's the start of the table.
# Measurements of HS 1813+61 made at RIT Obs, Aug 6, 2005 UT,
#   made by Michael Richmond and Tracy Davis in poor conditions.
# All data taken with 12-inch LX-200 + no filter + SBIG ST-8 CCD
#    no focal reducer, so at native f/10
# Each exposure 120 seconds long; tabulated times are midexposure
#    and accurate only to +/- 1 second.
# 'mag' is a differential magnitude based on ensemble photometry
#    which has been shifted so USNOB1.0 1514-0236071 has mag=13.77
#    (a rough guess = (B+R)/2 and the USNO B1.0 magnitudes).
#
# UT day      JD-2,450,000  HJD-2,450,000   mag    uncert
Aug06.07728      3588.57728   3588.57778  14.618  0.014
Aug06.07884      3588.57884   3588.57934  14.591  0.012
Aug06.08045      3588.58045   3588.58095  14.584  0.013
Last modified 8/6/2005 by MWR.