On the night of Apr 28/29, 2015, I observed the cataclysmic variable stars
Both showed nice variations during my run, though clouds passed overhead and interrupted the work briefly several times.
You can read more about UX UMa at
The main setup was:
Notes from the night
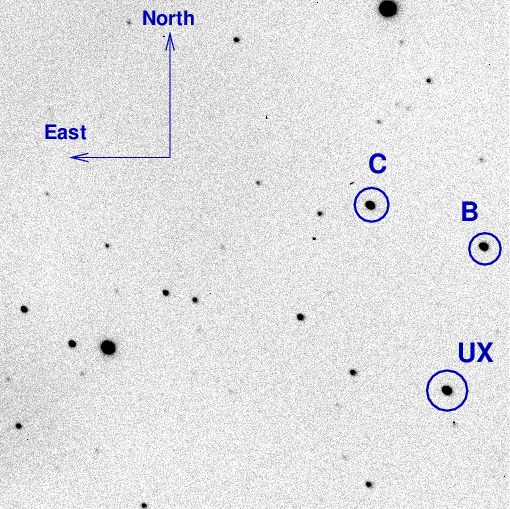
Here's a chart of the field of UX UMa which is at
RA = 13:36:41.0 Dec = +51:54:49 (J2000)
The reference stars B and C marked above have photometry measured by the AAVSO, in their chart 14809BTX. I used star B to convert the instrumental magnitudes to the V-band scale (though of course, they are unfiltered measurements)
B = 000-BBT-789 = UCAC44 710-053538 V = 13.370
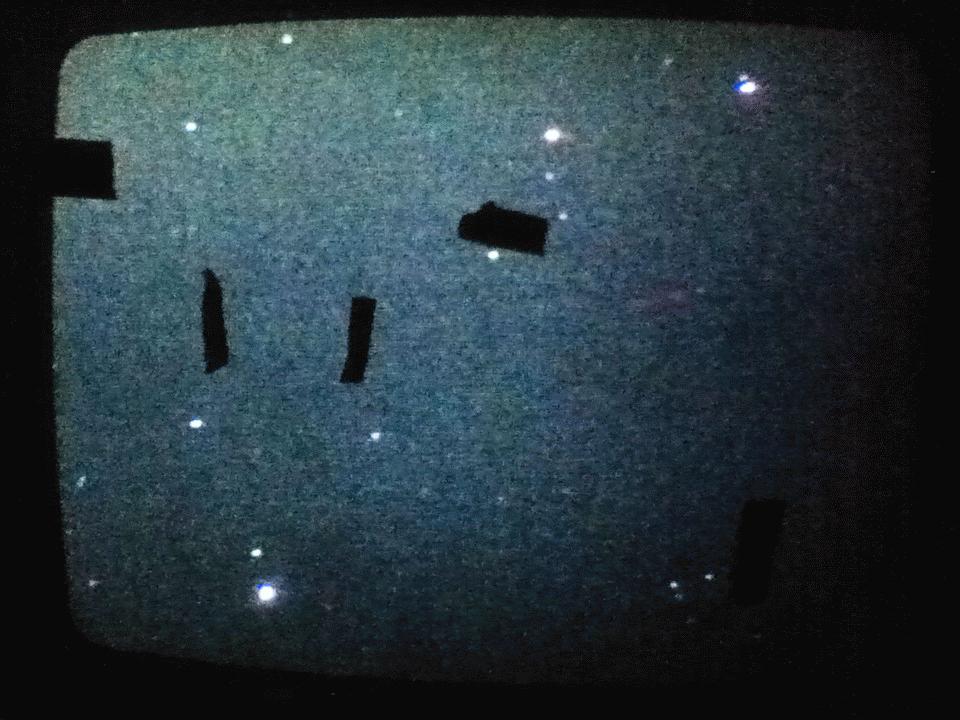
The television camera on the finder scope shows the following when we're pointed at UX-UMa. North up, East left, field about 1 degree on a side. The two pieces of tape in the upper-left corner show the location of the center of the CCD field, very roughly. The bright star near the bottom is HD 118557.
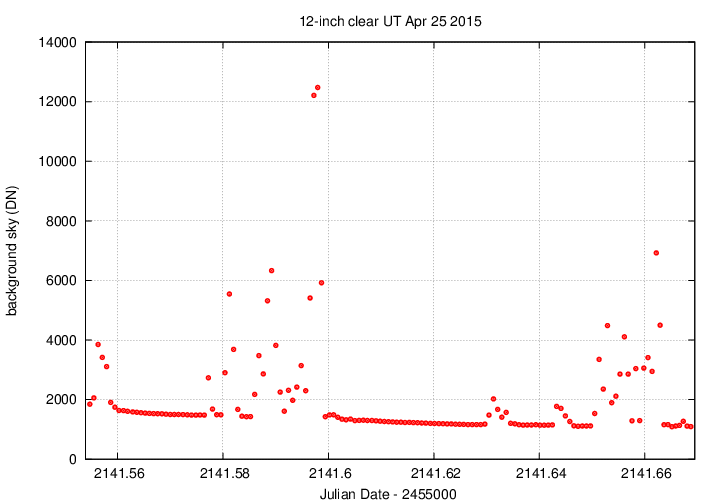
Below is a graph showing the sky brightness as a function of time during the observing run. Note the occasional brief clouds.
Below is a graph showing the FWHM as a function of time during the observing run. The telescope became slightly defocused as the temperature dropped, but only by a small amount. No big deal.

I used 60-second exposures during this observing run.
The image adjustment factor graph shows the same two periods of clouds that appear in the graph of sky brightness.
![]()
Using aperture photometry with a radius of 4 pixels (radius of 5.7 arcsec), I measured the instrumental magnitudes of a number of reference stars and the target. Following the procedures outlined by Kent Honeycutt's article on inhomogeneous ensemble photometry, I used all stars available in each image to define a reference frame, and measured each star against this frame. I used the AAVSO V-band magnitude of star "B" to convert the ensemble instrumental magnitudes to a reported "V"-band magnitude (but remember, it's a clear filter).
Sigma-vs-mag plot: The brightest star, to the lower left in the charts above, was saturated and marked as variable in the solution. The second-brightest star is UX UMa.
![]()
The target, shown in green, shows lots of variations, and a full eclipse near the end of the run.
![]()
# Measurements of UX_UMa made at RIT Obs, Apr 29, 2015 UT,
#    in fair conditions,
#    by Michael Richmond, using 12-inch Meade and SBIG ST-9E CCD.
# Exposures 60 seconds long, no filter.
# Tabulated times are midexposure (FITS header time - half exposure length)
#    and accurate only to +/- 1 second (??).
# 'mag' is a differential magnitude based on ensemble photometry
#    using a circular aperture of radius 5.7 arcseconds.
#    which has been shifted so UCAC4 710-053538 has mag=13.370
#    which is its V-band mag according to AAVSO chart 14809BTX.
#
# UT_day             JD            HJD        mag    uncert
Apr29.06286     2457141.56286  2457141.56514  12.913  0.005
Apr29.06365     2457141.56365  2457141.56593  12.930  0.005
Apr29.06443     2457141.56443  2457141.56671  12.964  0.005
After midnight, I switched to the cataclysmic variable star ASAS-SN15hd. It showed a sawtooth-shape lightcurve with quick rise and gradual fall, though at low signal-to-noise.
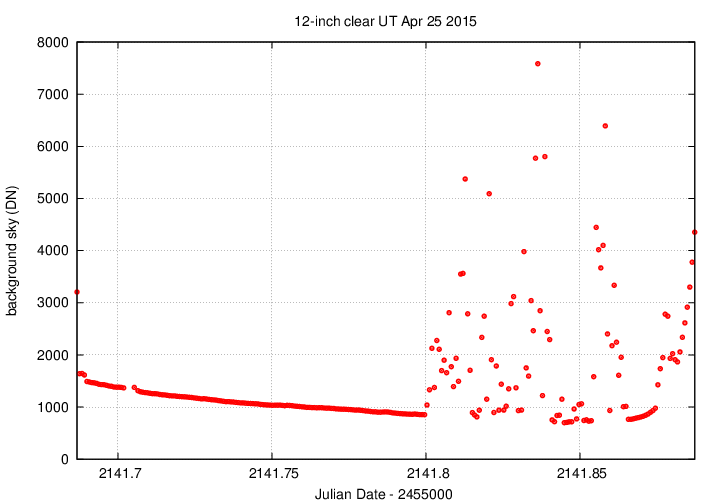
Below is a graph showing the sky brightness as a function of time during the observing run. Note the clouds after 2141.80. Sigh.
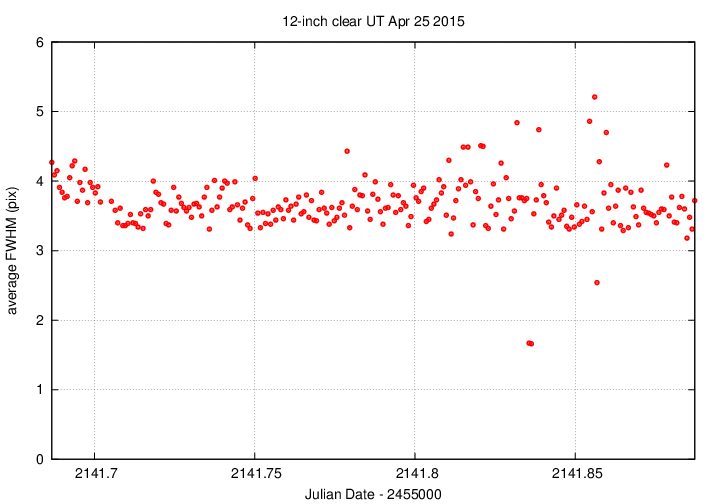
Below is a graph showing the FWHM as a function of time during the observing run. I did not refocus at all.
Here's a chart of the field of ASAS-SN15hd, which is at
RA = 17:31:25.39 Dec = +27:54:29.3 (J2000)
The chart is about 12x12 arcminutes.
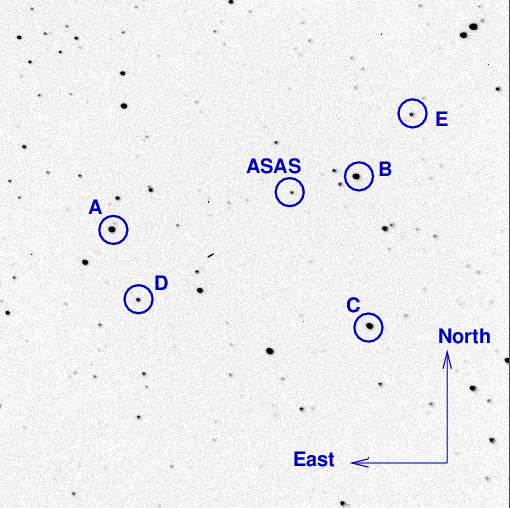
Several of the reference stars marked above have photometry measured by the AAVSO. I used star "B" to convert the instrumental magnitudes to the V-band scale (though of course, they are unfiltered measurements)
B = UCAC4 590-060017 = 000-BLQ-179 V = 13.184
I used 60-second exposures during this observing run. The target had only about 200 peak counts/2 with this exposure time, and the bright stars A and B about 4000-6000.
The image adjustment factor graph shows that clouds were present for most of the second half of the run. Rats.
![]()
Using aperture photometry with a radius of 4 pixels (radius of 5.7 arcsec), I measured the instrumental magnitudes of a number of reference stars and the target. Following the procedures outlined by Kent Honeycutt's article on inhomogeneous ensemble photometry, I used all stars available in each image to define a reference frame, and measured each star against this frame. I used the UCAC4 V-band magnitude of star "B" to convert the ensemble instrumental magnitudes to a reported "V"-band magnitude (but remember, it's a clear filter).
Sigma-vs-mag plot: The target is one of the two outliers at differential mag 4.1. One of the other outliers is due to edge effects, but I'm not sure about the other one near mag 4.1.
![]()
The target, shown in green, shows smooth variations with an amplitude of about 0.20 mag, some 3 or 4 times larger than its amplitude 4 nights ago.
![]()
# Measurements of ASAS_SN15hd made at RIT Obs, Apr 29, 2015 UT,
#    in good, then bad, conditions,
#    by Michael Richmond, using 12-inch Meade and SBIG ST-9E CCD.
# Exposures 60 seconds long, no filter.
# Tabulated times are midexposure (FITS header time - half exposure length)
#    and accurate only to +/- 1 second (??).
# 'mag' is a differential magnitude based on ensemble photometry
#    using a circular aperture of radius 5.7 arcseconds.
#    which has been shifted so UCAC4 590-060017 has mag=13.184
#    which is its V-band mag according to AAVSO chart 14809BTP.
#
# UT_day             JD            HJD        mag    uncert
Apr29.18750     2457141.68750  2457141.69023  16.444  0.057
Apr29.18830     2457141.68830  2457141.69103  16.302  0.048
Apr29.18909     2457141.68909  2457141.69182  16.347  0.053