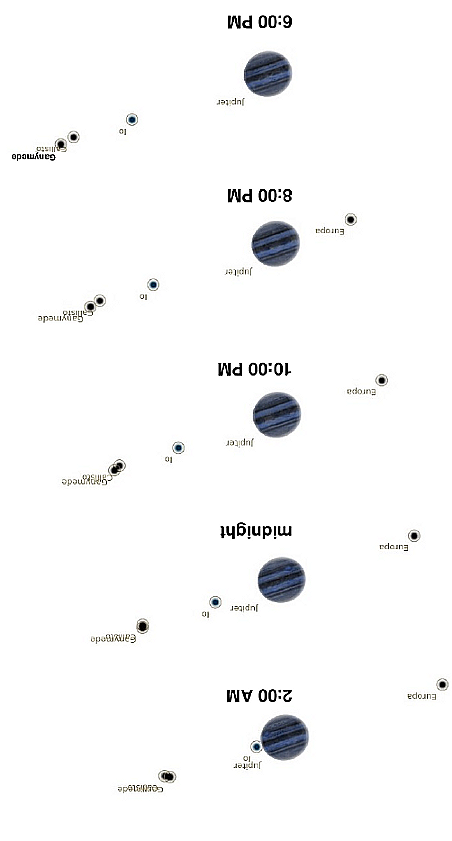
We welcomed visitors to the RIT Observatory this evening. RIT student Vincent Wilkens came to help, as did several faculty: Tracy Davis, Stacey Davis, Jen Connelly. Thanks very much to you all!
The weather was pretty good: clear, but cold and windy. We spent about 90 minutes looking at Venus, the Moon, Jupiter, M81 and M82, and M104. We did not stay long enough to wait for Saturn to rise.
Tonight, you can see the Moon, Venus, Jupiter, and maybe even Saturn through our telescopes. We can also show you a galaxy more than 10 million light years away!

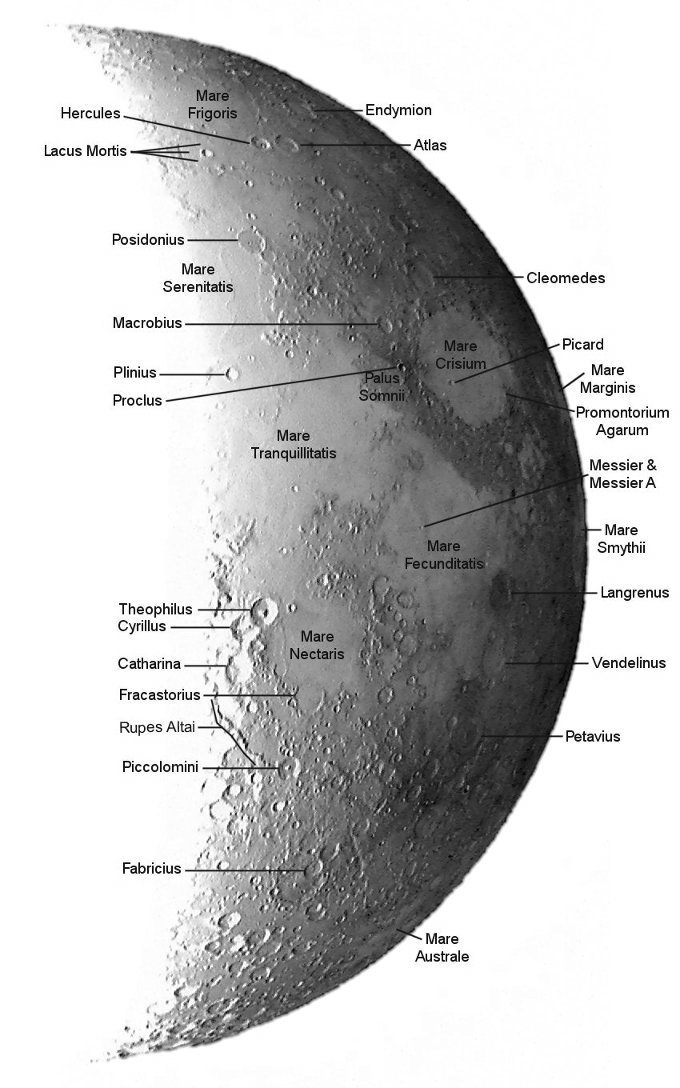
When you look at the Moon tonight, you might see craters, mountains, and other features. Use the map on the other side of the page to help you identify what you see.
Thanks for coming to the RIT Observatory! Please check our web page for future events.
Another good place to check is the Astronomy Section of the Rochester Academy of Sciences:
On the night of Apr 24/25, 2015, I observed the cataclysmic variable star ASAS-SN15hd It showed a noisy sinusoidal variation in brightness during the observing run, due to the low signal-to-noise of the measuremnents.
The main setup was:
Notes from the night
Below is a graph showing the sky brightness as a function of time during the observing run. Note the lack of clouds! Rah!

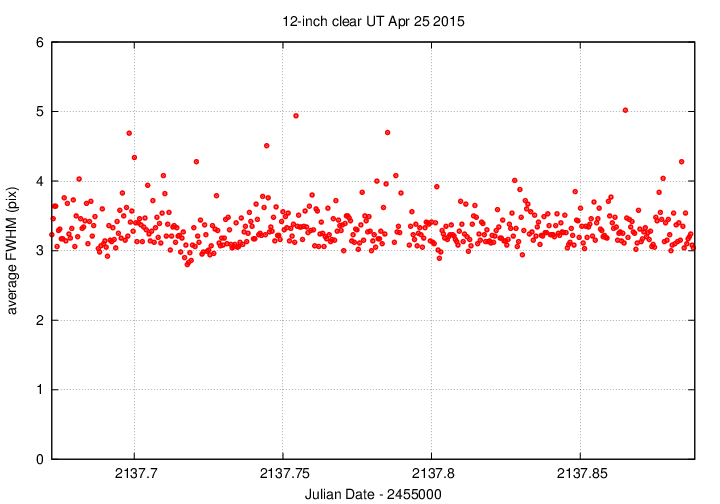
Below is a graph showing the FWHM as a function of time during the observing run. I did not refocus at all.
Here's a chart of the field of ASAS-SN15hd, which is at
RA = 17:31:25.39 Dec = +27:54:29.3 (J2000)
The chart is about 12x12 arcminutes.
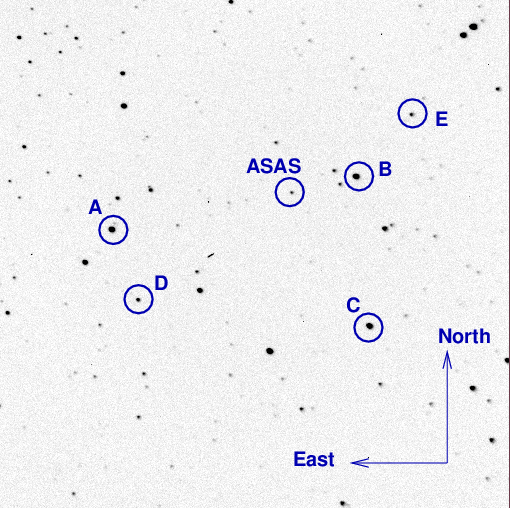
Several of the reference stars marked above have photometry measured by the AAVSO. I used star "B" to convert the instrumental magnitudes to the V-band scale (though of course, they are unfiltered measurements)
B = UCAC4 590-060017 = 000-BLQ-179 V = 13.184
I used 30-second exposures during this observing run. The target had only about 300 peak counts/2 with this exposure time, and the bright stars A and B about 5000-7000. Clearly, I could use longer exposure times.
The image adjustment factor graph shows no real evidence for clouds.
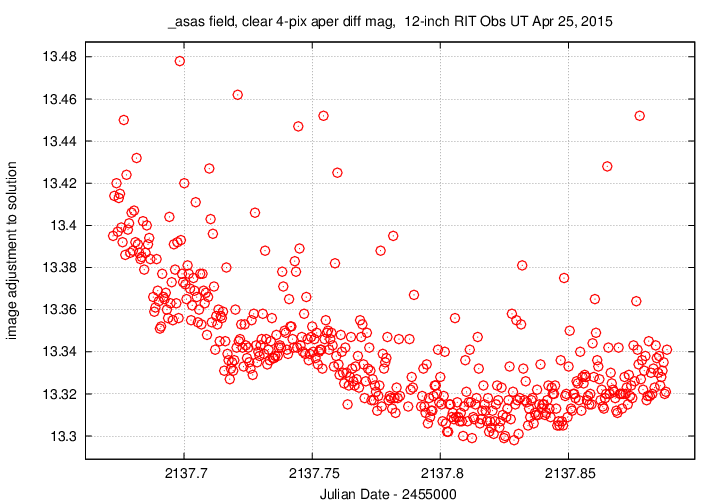
Using aperture photometry with a radius of 4 pixels (radius of 5.7 arcsec), I measured the instrumental magnitudes of a number of reference stars and the target. Following the procedures outlined by Kent Honeycutt's article on inhomogeneous ensemble photometry, I used all stars available in each image to define a reference frame, and measured each star against this frame. I used the UCAC4 V-band magnitude of star "B" to convert the ensemble instrumental magnitudes to a reported "V"-band magnitude (but remember, it's a clear filter).
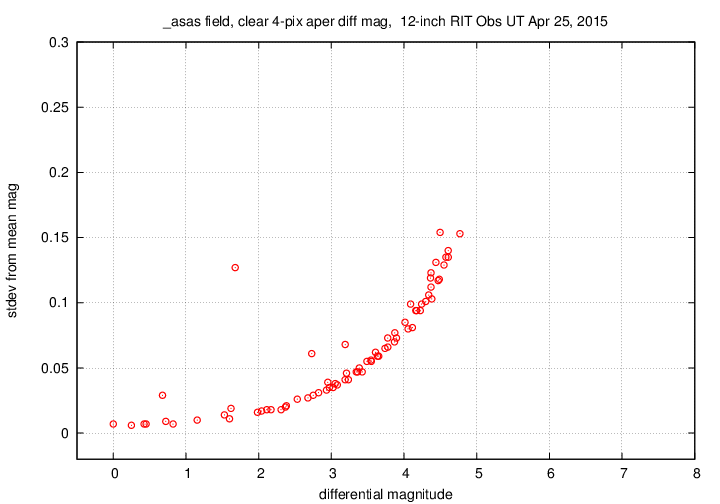
Sigma-vs-mag plot: The target is in the main locus at instr. mag 3.21. The outliers are all due to edge effects or close binaries.
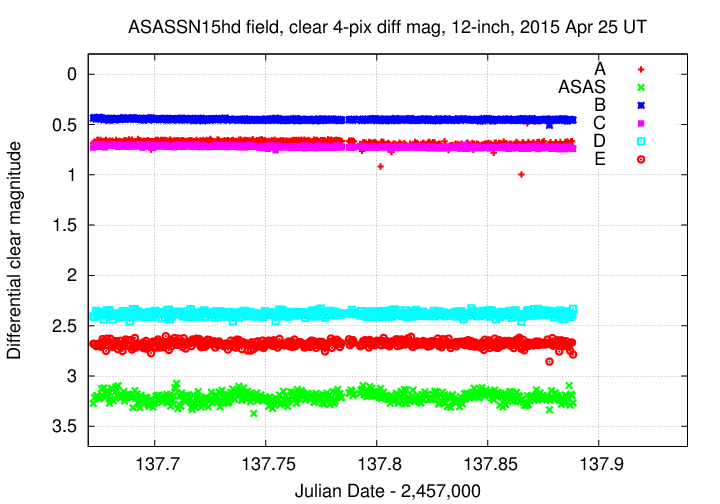
The target, shown in green, shows smooth variations with an amplitude of about 0.05 mag.
# Measurements of ASAS_SN15hd made at RIT Obs, Apr 25, 2014 UT,
#    in very good conditions,
#    by Michael Richmond, using 12-inch Meade and SBIG ST-9E CCD.
# Exposures 30 seconds long, no filter.
# Tabulated times are midexposure (FITS header time - half exposure length)
#    and accurate only to +/- 1 second (??).
# 'mag' is a differential magnitude based on ensemble photometry
#    using a circular aperture of radius 5.7 arcseconds.
#    which has been shifted so UCAC4 590-060017 has mag=13.184
#    which is its V-band mag according to AAVSO chart 14792CC.
#
# UT_day             JD            HJD        mag    uncert
Apr25.17231     2457137.67231  2457137.67487  16.008  0.046
Apr25.17278     2457137.67278  2457137.67534  15.950  0.043
Apr25.17362     2457137.67362  2457137.67618  15.932  0.042
Last modified 4/25/2015 by MWR.