On the night of Apr 15/16, 2015, I observed the cataclysmic variable star CRTS CSS100707 J164950+035835 . It showed a nice sinusoidal light curve during my 3.5-hour observing run.
You can read (a little) more about this star at
The main setup was:
Notes from the night
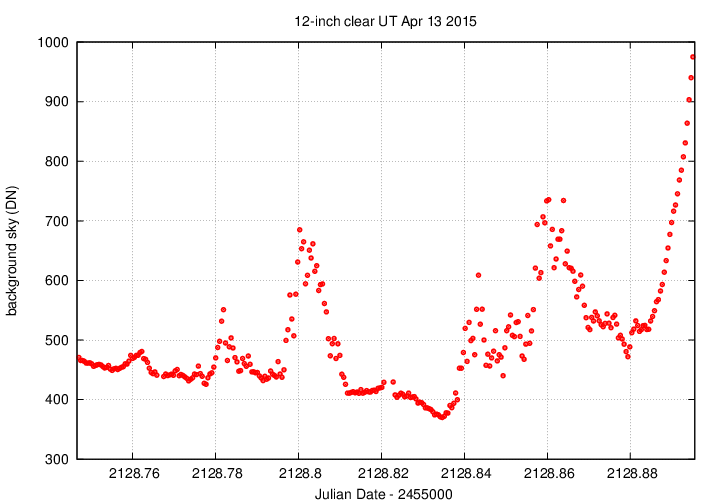
Below is a graph showing the sky brightness as a function of time during the observing run. Note the clouds throughout.
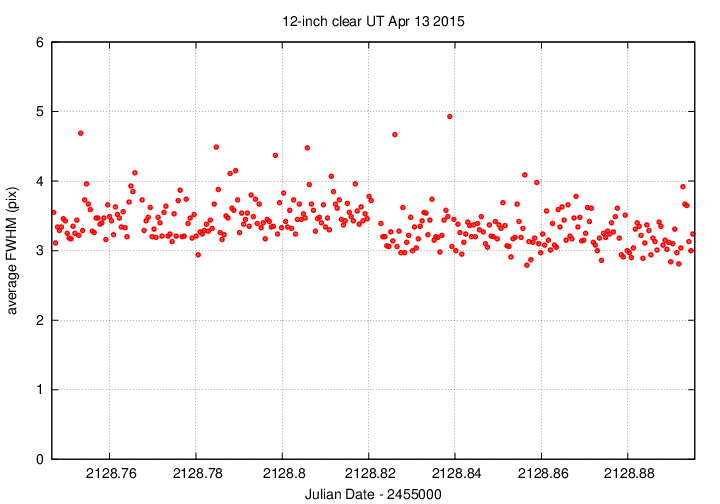
Below is a graph showing the FWHM as a function of time during the observing run. I re-focused halfway through, which helped.
Here's a chart of the field of CRTS 1649, which is at
RA = 16:49:50.4 Dec = +03:58:35 (J2000)
The chart is about 12x12 arcminutes.
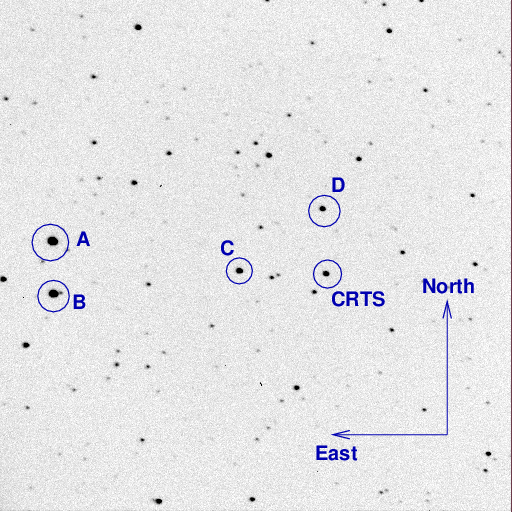
One of the reference stars marked above has photometry measured by the UCAC4. I used this star to convert the instrumental magnitudes to the V-band scale (though of course, they are unfiltered measurements)
A = UCAC4 471-057476 V = 11.565
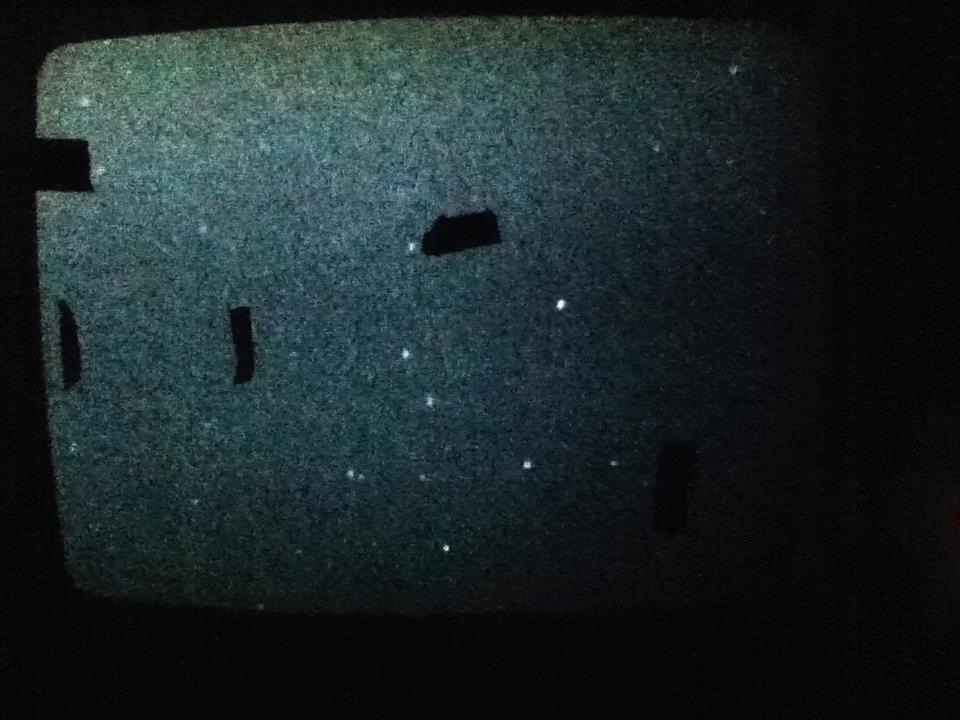
The television camera on the finder scope shows the following when we're pointed at CRTS 1649. North up, East left, field about 1 degree on a side. The two pieces of tape in the central area show the location of the center of the CCD field, very roughly.
I used 30-second exposures during this observing run. The target had about 2000 counts/2 with this exposure time, and the bright stars A and B about 10,000 - 14,000.
The image adjustment factor graph shows clouds passing over several times.
![]()
Using aperture photometry with a radius of 4 pixels (radius of 5.7 arcsec), I measured the instrumental magnitudes of a number of reference stars and the target. Following the procedures outlined by Kent Honeycutt's article on inhomogeneous ensemble photometry, I used all stars available in each image to define a reference frame, and measured each star against this frame. I used the UCAC4 V-band magnitude of star "B" to convert the ensemble instrumental magnitudes to a reported "V"-band magnitude (but remember, it's a clear filter).
Sigma-vs-mag plot: The target is the outlier at mag 2.3. The other two bright outliers are due to big cosmic rays landing on each star in one image.
![]()
The target, shown in green, shows smooth variations with an amplitude of about 0.25 mag.
![]()
# Measurements of CRTSJ164950.1+035835 made at RIT Obs, Apr 16, 2014 UT,
#    in fair conditions,
#    by Michael Richmond, using 12-inch Meade and SBIG ST-9E CCD.
# Exposures 30 seconds long, no filter.
# Tabulated times are midexposure (FITS header time - half exposure length)
#    and accurate only to +/- 1 second (??).
# 'mag' is a differential magnitude based on ensemble photometry
#    using a circular aperture of radius 5.6 arcseconds.
#    which has been shifted so UCAC4 471-057476 has mag=11.565
#    which is its V-band mag according to UCAC4
#
# UT_day             JD            HJD        mag    uncert
Apr16.24660     2457128.74660  2457128.75030  13.538  0.014
Apr16.24705     2457128.74705  2457128.75075  13.543  0.014
Apr16.24749     2457128.74749  2457128.75119  13.539  0.014
Last modified 4/16/2015 by MWR.