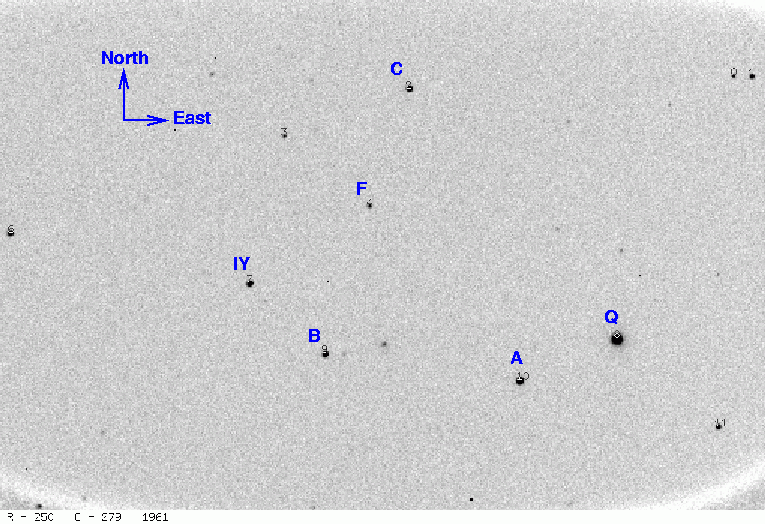
On the night of Apr 13/14, 2006 EST, I used the RIT Observatory's 12-inch Meade telescope and SBIG ST8E CCD camera to take pictures of the cataclysmic variable IY UMa, a CBA target
The plan:
Notes from the night
For background information on this cataclysmic variable, read
If we call the start of the outburst UT Apr 08, 2006, based on Patrick Schmeer's information, then these observations, on UT Apr 14, occur on day 6.
This is a chart of the field based on images taken UT Apr 12. The bright star "Q" was saturated in my images, so I discarded it from the solution. Click on the chart for a larger version.
Arne Henden has calibrated stars in this field. He finds that the star marked "B" = USNOB1.0 1481-0247104 in the chart above has V = 13.554. My instrumental photometry falls somewhere between V and R passbands. I will shift the instrumental magnitudes so that the star "B" has Henden's mag V = 13.554.
I measured the instrumental magnitude of each star with aperture photometry, using a radius of 3 pixels = 5.6 arcseconds and sky defined by an annulus around each star. Following the procedures outlined by Kent Honeycutt's article on inhomogeneous ensemble photometry, I used all stars available in each image to define a reference frame, and measured each star against this frame.
Below is a graph of the scatter in differential magnitude versus magnitude.
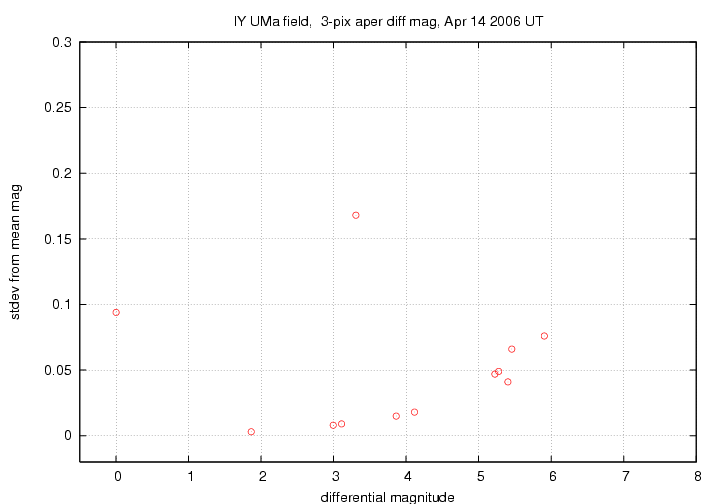
IY UMa is the star with the enormous scatter of over 0.15 mag. Star "B" has differential magnitude about 3.1 and scatter of 0.009 mag.
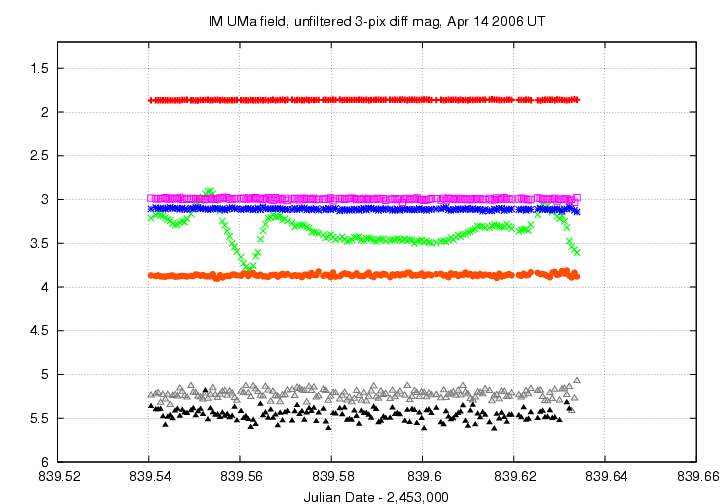
Light curves for selected stars in the field are shown below. Star "A" is in red, star "B" in blue. IY UMa, shown by light green crosses, is clearly varying like crazy. My observing run corresponds to a bit more than one period of the orbit.
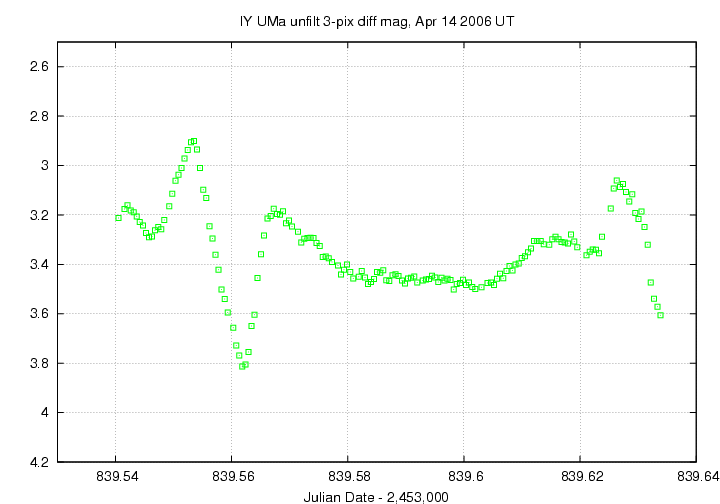
Here's a closeup of the variation in IY UMa itself, again marked by the light green crosses.
The shape of the light curve has changed considerably since my measurements two nights ago. Below is a comparison of the light curves; I have left the data from the first night (Apr 12 UT) untouched, but shifted the times of the later data so that the deep minimum occurs at the same location on the graph.
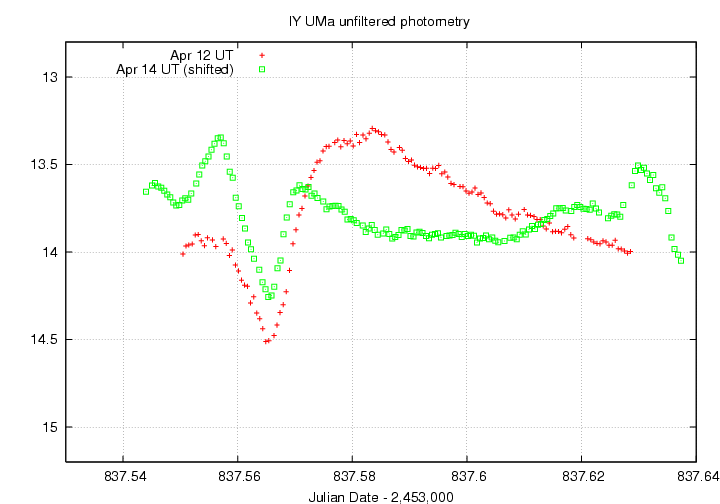
I've made a table of the measurements themselves, with three different flavors of time. The differential unfiltered magnitudes from the ensemble solution have been shifted so that the value of star "B" matches the Henden photometry.
Here's the start of the table.
# Measurements of IY UMa made at RIT Obs, Apr 14, 2006 UT,
#   made by Michael Richmond.
# All data taken with 12-inch LX-200 + no filter + SBIG ST-8 CCD
#    no focal reducer, so at native f/10
# Each exposure 30 seconds long; tabulated times are midexposure
#    and accurate only to +/- 1 second.
# 'mag' is a differential magnitude based on ensemble photometry
#    which has been shifted to match Henden's V-band magnitude
#    of star B = USNOB1.0 1481-0247104 so V=13.554.
#
# UT day      JD-2,450,000  HJD-2,450,000   mag    uncert
Apr14.04051      3839.54051   3839.54199  13.656  0.009
Apr14.04156      3839.54156   3839.54304  13.620  0.009
Apr14.04209      3839.54209   3839.54357  13.605  0.009
Just for fun, I tried combining the many, many images I took this evening in several ways. First, I co-added the images. I discarded the several trailed images to end up with 163 decent images; at 30 seconds each, that's 4890 seconds = 81.5 minutes of exposure time. My co-added exposure is on the left below; a scanned version of the POSS-II image is on the right.
My image doesn't go quite as deep as the POSS-II image (sigh), and has slightly worse spatial resolution, I think: my FWHM is about 4.8 arcseconds. Still, the faintest stars visible in the co-added image have R-band magnitudes of about 18.5, according to the USNO B1.0 catalog. That's pretty good.
I also wrote scripts to make movies of the entire night's collection of images. There are two versions:
I think the MPEG version shows the variability of IY UMa better: watch it carefully in the first quarter of the movie.
Last modified 4/14/2006 by MWR.