On the night of Apr 10/11, 2018, in the wee hours of the morning, I acquired a set of observations of the likely black-hole system MAXIJ1820+070, (also known as ASASSN-18ey ). Light clouds were scattered all over the sky for the first half of the run, so the early data is noisy; but it cleared up pretty well in the later stages.
The main setup was:
Notes from the night:
This optical and X-ray and radio transient is likely a black hole accreting material at a higher-than-usual rate. It has been the subject of many observers over the past two weeks -- see the trail of telegrams that include
The object is located at
RA = 18:20:21.9 Dec = +07:11:07.3
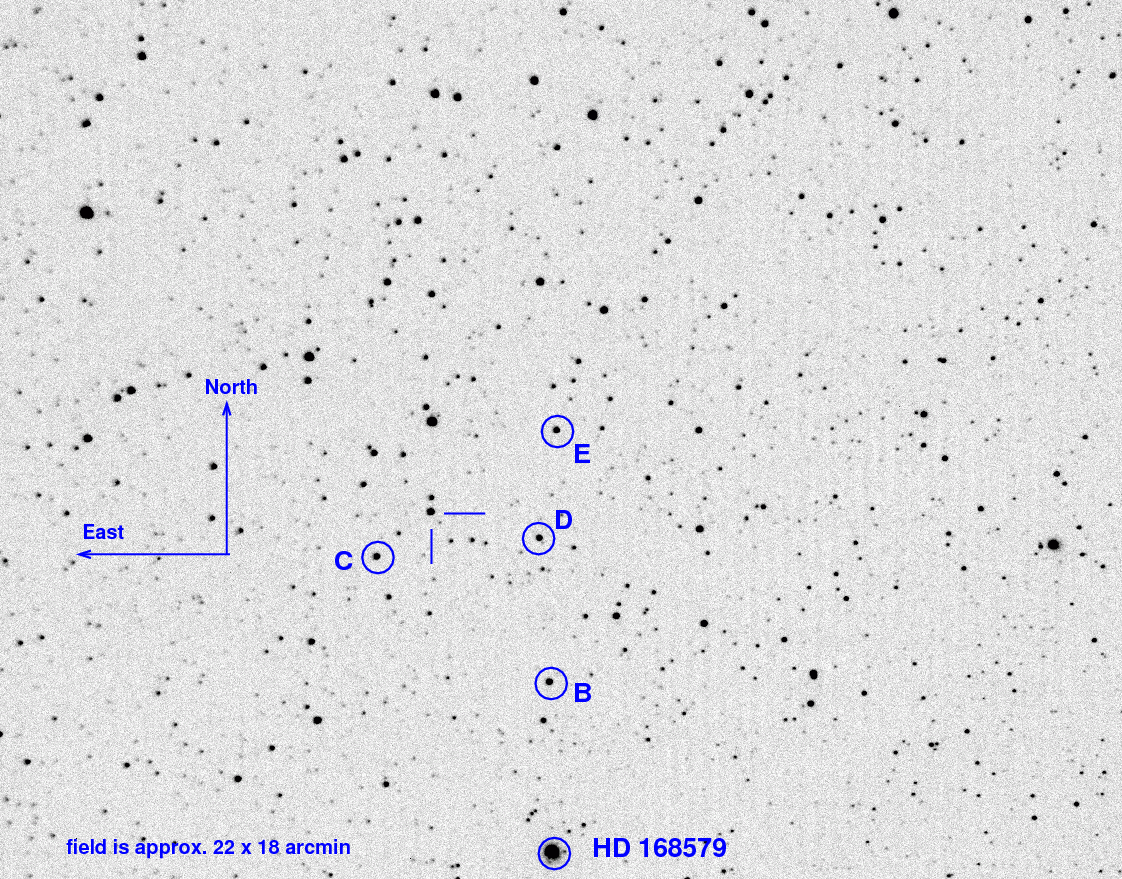
A chart of the field is shown below. The size of the chart is about 22 by 18 arcminutes.
I've marked the location of several comparison stars, which also appear in light curves below. Stars C, D, and E are mentioned by the Tomoe Gozen team in ATel 11426, but all three are rather red, with (B-V) ranging from 1.14 to 1.37. Star B is one of the bluest nearby bright stars, with (B-V) = 0.52.
  star        UCAC4              B          V
----------------------------------------------------
   B       486-079513        12.975     12.454
   C       486-079608        13.968     12.830
   D       486-079523        14.637     13.272
   E       487-077858        14.637     13.272

----------------------------------------------------
High sky values in the first half indicate clouds early ..
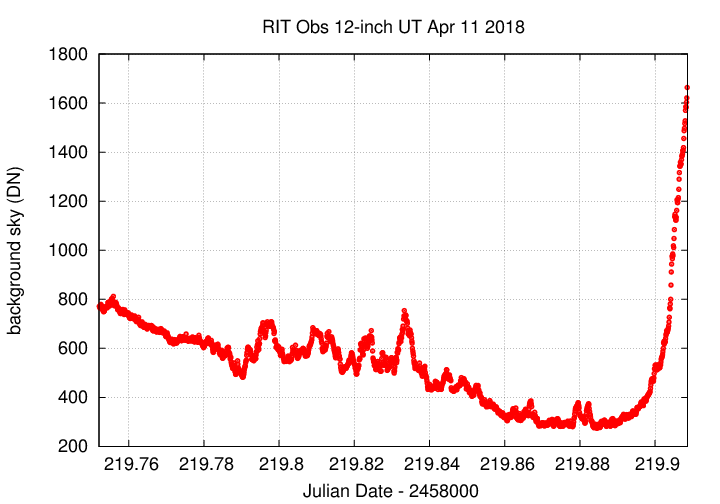
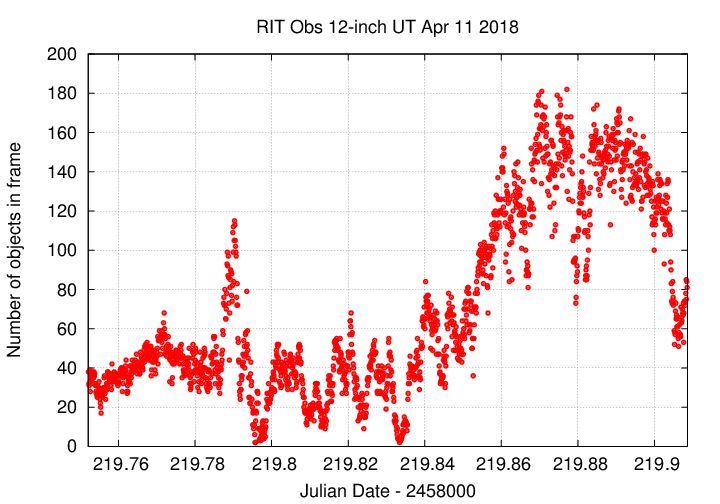
... as does the small number of objects found in each image.
The FWHM was pretty steady, despite the clouds.
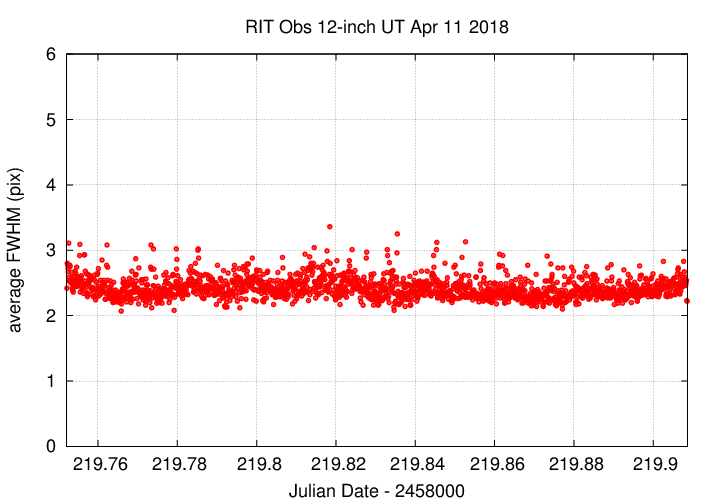
Image adjustment factor shows clouds very clearly.
![]()
Using aperture photometry with a radius of 3 pixels (binned 3x3, each pixel is 1.98 arcsec, so a radius of 5.9 arcsec), I measured the instrumental magnitudes of a number of reference stars and the target. Following the procedures outlined by Kent Honeycutt's article on inhomogeneous ensemble photometry, I used all stars available in each image to define a reference frame, and measured each star against this frame.
Sigma-vs-mag plots show that the floor was about 0.013 mag overall, but only 0.009 mag in the clear, second half. The brightest outlier is a saturated star, and the outlier around instrumental magnitude is MAXI J1820+070.
![]()
Here are light curves of the variable and the field stars.
![]()
I used the UCAC value for the V-band magnitude of star "B" = UCAC4 486-079513 to shift the ensemble magnitudes to the standard V-band scale -- but remember that these are UNFILTERED measurements.
Here's a closeup on the variable. I'll connect the dots to make its behavior a bit easier to see.
![]()
You can download my measurements below. A copy of the header of the file is shown to explain the format.
# Measurements of MAXIJ1820+070 made at RIT Obs, UT 2018 Apr 11,
#    in poor conditions (and high airmass),
#    by Michael Richmond,
#    using Meade 12-inch LX200 and ATIK 11000.
# Exposures 5 seconds long, no filter.
# Tabulated times are midexposure (FITS header time - half exposure length)
#    and accurate only to +/- 1 second (??).
# 'mag' is a differential magnitude based on ensemble photometry
#    using a circular aperture of radius 3 pix = 5.9 arcseconds.
#    which has been shifted so UCAC4 486-079513 has mag=12.454
#    which is its V-band magnitude according to UCAC4.
#
# UT_day             JD            HJD        mag    uncert
Apr11.25208     2458219.75208  2458219.75339  12.254  0.027
Apr11.25216     2458219.75216  2458219.75347  12.262  0.027
Apr11.25226     2458219.75226  2458219.75357  12.192  0.027
Last modified 4/12/2018 by MWR.