On the night of Apr 05/06, 2016, Jen Connelly, Kaitlin Schmidt, and I tested the new ATIK CCD camera with its filterwheel on the telescope, together for the first time. The conditions were good, and we were able to take some pretty pictures of M42 as well as testing the camera's capabilities on HH UMa.
The main setup was:
We're still working to understand the camera, since its design -- an interline-transfer CCD -- causes it to behave unlike the conventional full-frame CCDs we've used in the past.
We took a series of dark frames with a set of increasing exposure times. It may help to see the full list of all images taken on this night , but in short, the exposure times were 1, 2, 12, 20 and 40 seconds. We used a repeating sequence like this:
12, 2, 1, 20, 40, 12, 2, 1, 20, 40, 12, 2, 1, etc.
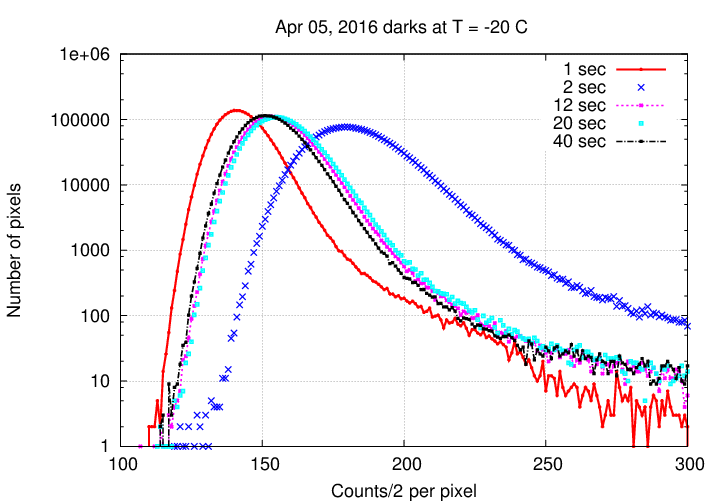
I combined 5 images at each exposure time via the median process to create "master" dark frames.
Histograms of the pixel values of these "master" frames reveal a puzzle: the typical pixel value increases from 1-sec to 2-sec, but then decreases from 2-sec to 12-sec!
This makes so little sense to me that I wonder if we somehow mis-labelled the exposure times for each dark image. The FITS headers agree with our file names, but I still wonder if there could be some sort of mixup here.
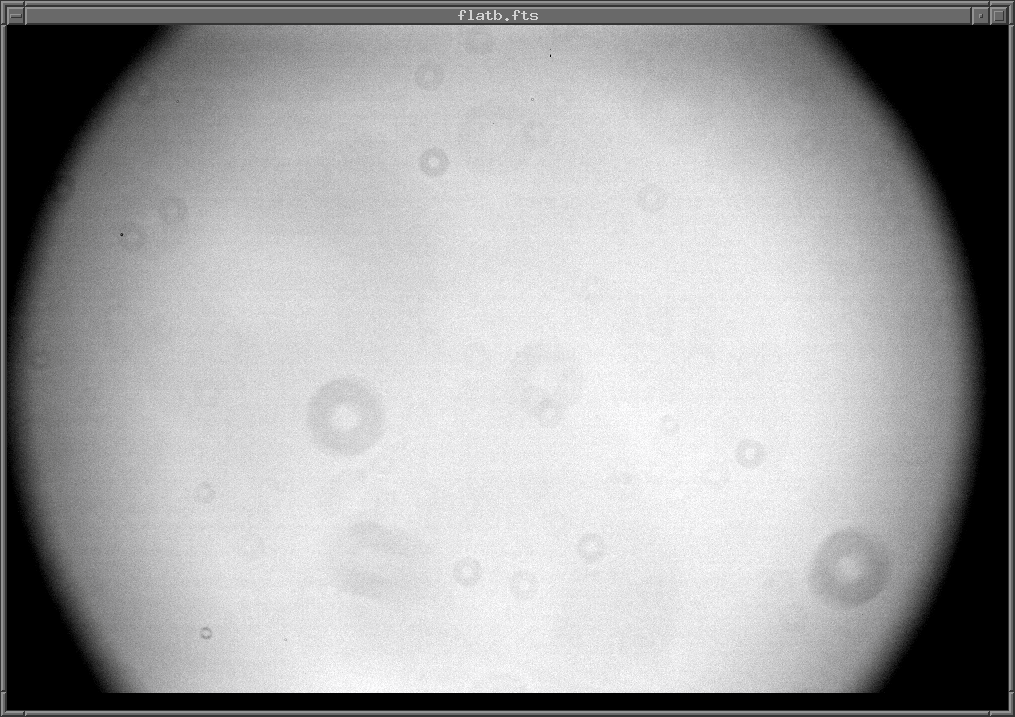
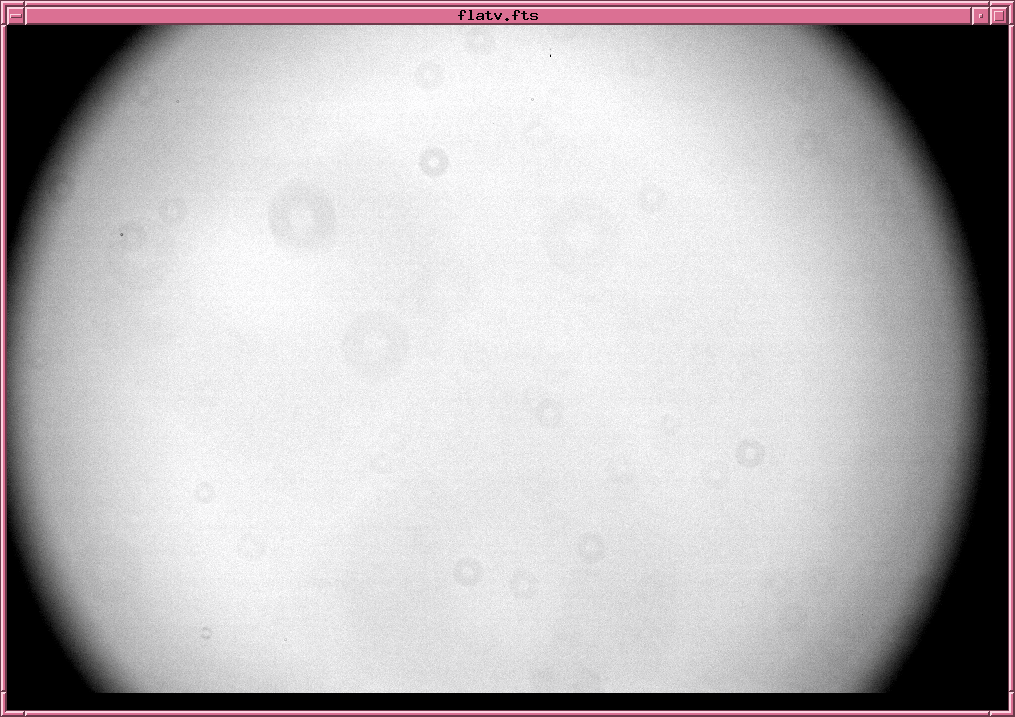
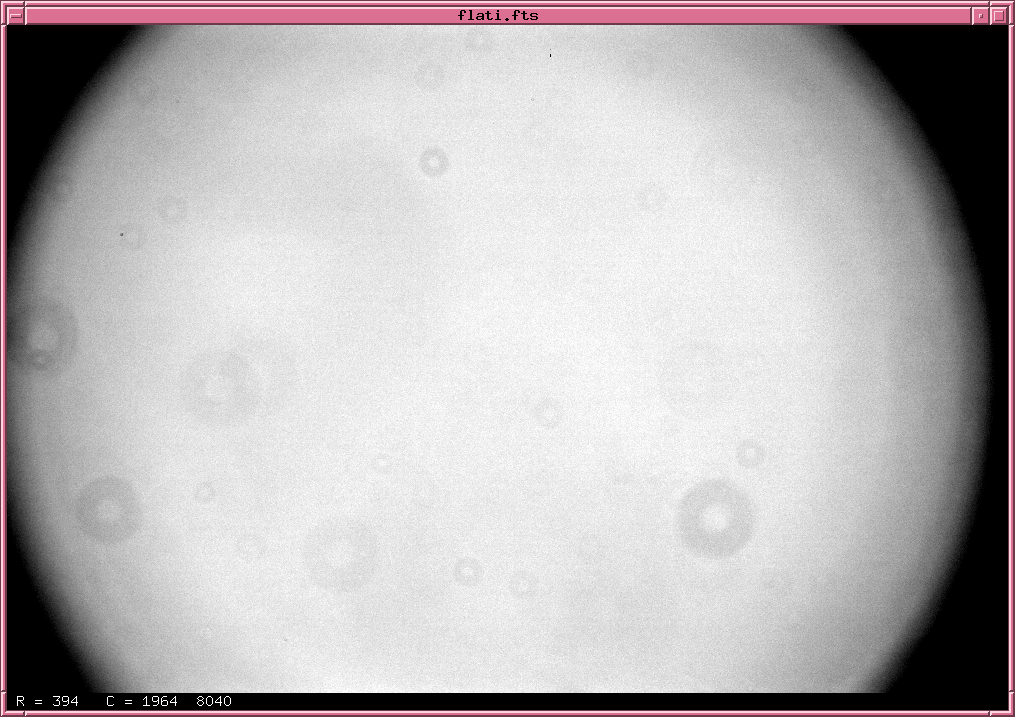
We also acquired domeflats for each of the 5 filters, UBVRI. A test 60-second exposure in U-band showed that any decent flatfield would require minutes of exposure, so we gave up. The exposure times for the other filters were:
 filter   exptime         counts per pixel
---------------------------------------------
   B        12               25000
   V         2               25000
   R         1               20000
   I         2               22000
---------------------------------------------
All the flats show similar vignetting.

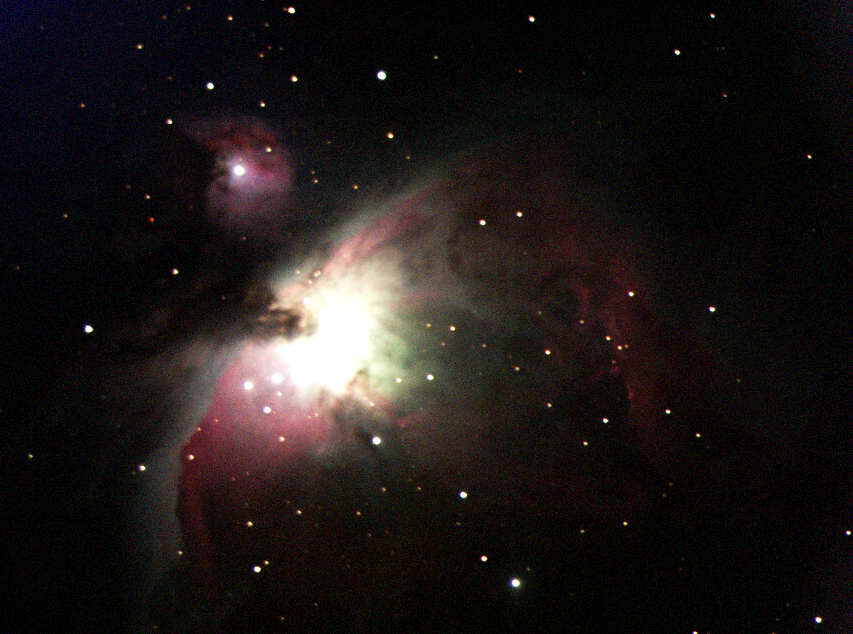
After focusing the telescope in B-band, we took pictures of the Orion Nebula: 3x20 seconds each in B-band, 3x12 seconds each in V and R. We did not re-focus after switching filters, and therefore discovered that the filters are not quite parfocal.
The FWHM of the images is 3.3, 4.6, and 5.4 pixels, respectively. Since our focusing unit does not have a numerical readout, it will not be easy to change the focus appropriately when switching filters.
I made a color composite image in the following manner:
The result is sort of halfway decent:
We observed the variable star HH UMa as part of Kaitlin Schmidt's capstone research project. We have previously observed this star with the RIT Observatory 12-inch telescope and SBIG ST-9E camera, and with the WIYN 0.9-m telescope and HDI camera.
Conditions were pretty good. There was no moon, so the skies were dark. Measurements of the sky background value (B-band are the higher ones, V-band the lower) show a brief and small bump in the middle of the run, due to thin clouds. The FWHM was a bit larger than 2 pixels (= 2.6 arcsec) for most of the run, though quite a few images showed a bit of trailing.
The lack of guider really hurt, as stars drifted across the chip quite a distance between pointing corrections. That can cause significant, systematic errors if stars drift into or out of the vignetted regions.
Here's a chart of the field of HH UMa, which is at
RA = 11:04:48.1 Dec = +35:36:27 (J2000)
The chart is about 12x12 arcminutes.
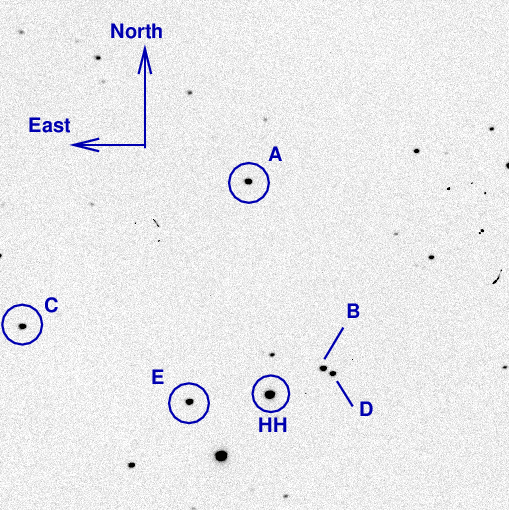
Among the labelled stars is
A UCAC4 629-045393 V = 12.721
There were no good guide stars, so quite a few images had trailing. Using aperture photometry with a radius of 5 pixels (radius of 6.7 arcsec), I measured the instrumental magnitudes of a number of reference stars and the target. Following the procedures outlined by Kent Honeycutt's article on inhomogeneous ensemble photometry, I used all stars available in each image to define a reference frame, and measured each star against this frame.
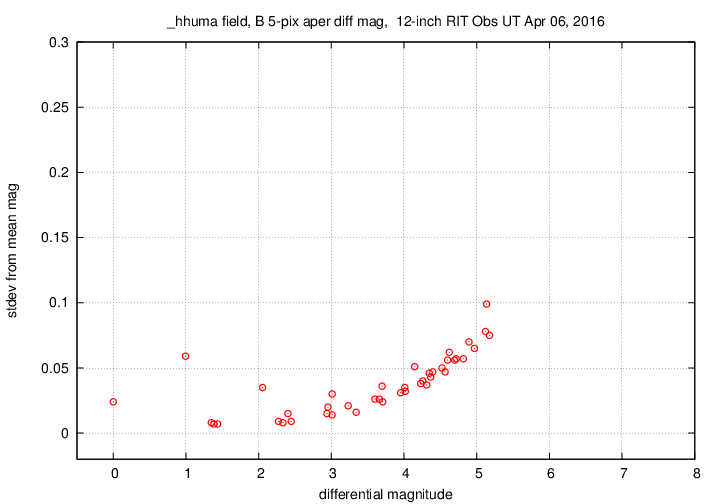
Sigma-vs-mag plots: HH UMa is the second-brightest star, and clearly varies. First, in B-band:
Now, in V-band:
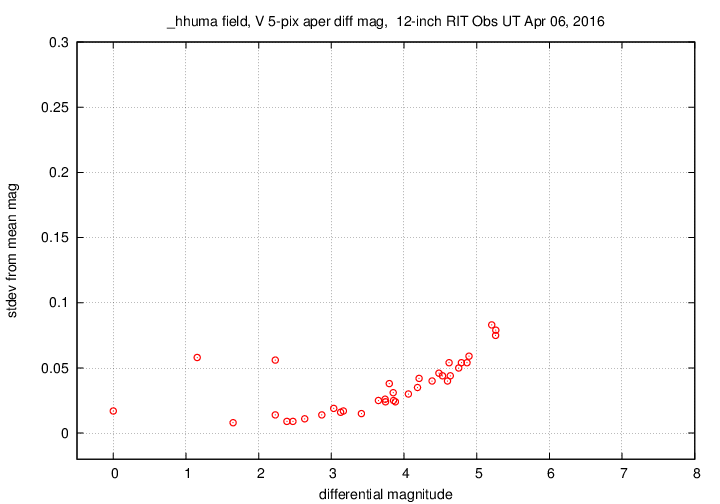
The floor of the uncertainty per measurement in this ensemble is about 0.007 to 0.009 magnitudes. That's pretty good, but not great. I suspect that the drift of stars across the detector is responsible for quite a bit of this scatter.
Image adjustment factor shows evidence for just a bit of clouds, and a few outliers due to trailing. First, the B-band data, then the V-band data.
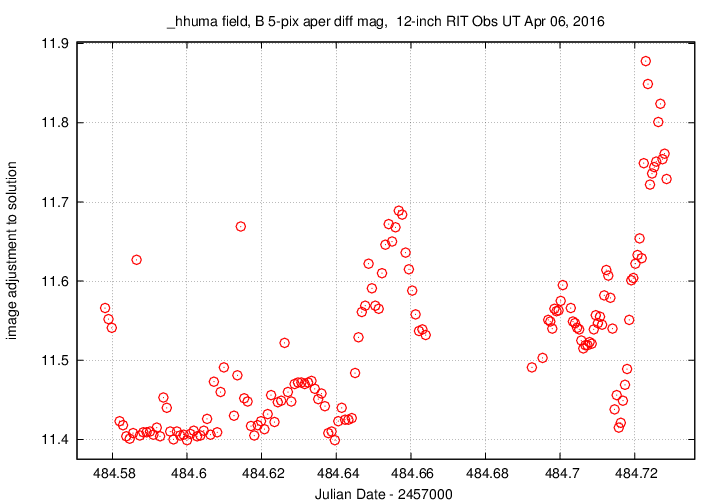
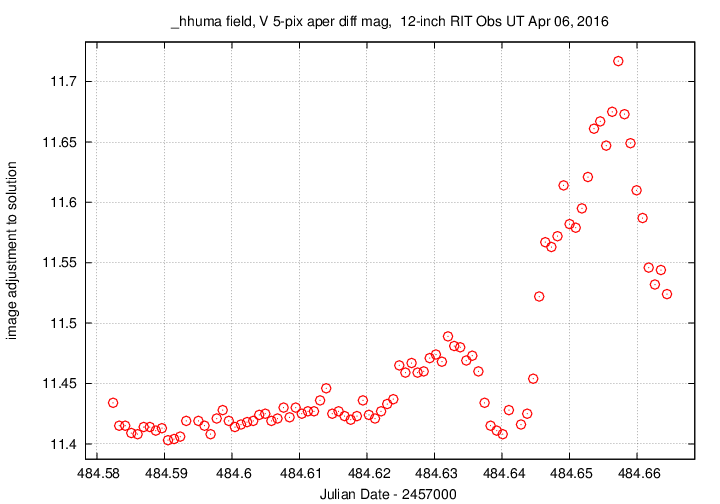
Note that the V-band data stops in the middle of the run, during the gap which begins around 484.66. The filterwheel "froze" when commanded to move the V-filter position for image 96 in a long sequence. There was no error message, so we didn't notice that the data acquisition had stalled -- thus, the gap in data.
We were unable to cause the filterwheel to move V when we investigated during the night ... but we found that the wheel WOULD move to any other filter: U, B, R, and I were all fine. What caused this problem? I don't know. The temperature was low -- about -8 Celsius = 18 Fahrenheit; was that a factor?
We modified the sequence to acquire only B-band images, and continued for another hour or so.
Two days later, I tested the filterwheel when it was not attached to the camera or the telescope -- just sitting on a table indoors. It moved to every filter position, including V-band, without any problems. Well, I hope it continues to do so.
As a result of this gap, we missed measuring a minimum in both B and V; at least in B-band, we got data on both sides.

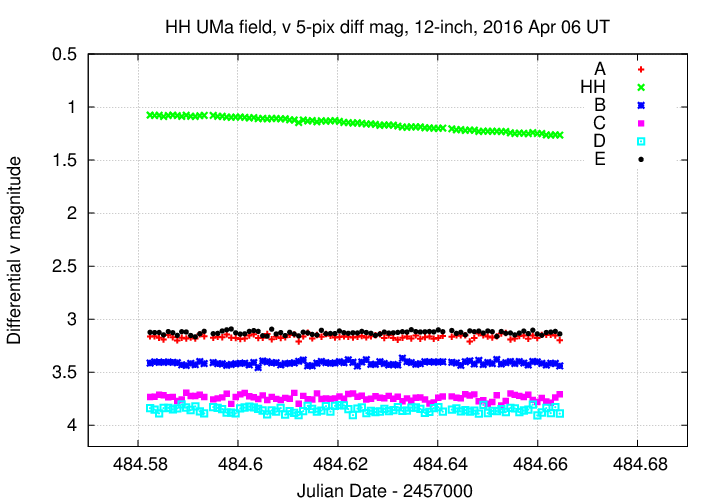
In the B-band graph above, note the light curve of star "X" shown by black circles. The star appears to be varying in brightness ... but is not. The apparent change in brightness is caused by the star moving from very close to the eastern edge of the image -- where the vignetting is strong -- towards the center as the telescope slowly drifted. The dome flatfields over-corrected for the vignetting at first, then under-corrected later; when the star finally moved into the "flat" central portion of the chip, its apparent brightness remained relatively constant.
We must beware of the vignetting, which is not always obvious to the eye.
Last modified 4/8/2016 by MWR.