There are many ways to determine the period of a variable star from a set of photometric measurements. One of the simplest to understand is the "string-length" method. You can find a good description of this technique in a paper by Mike Dworetsky:
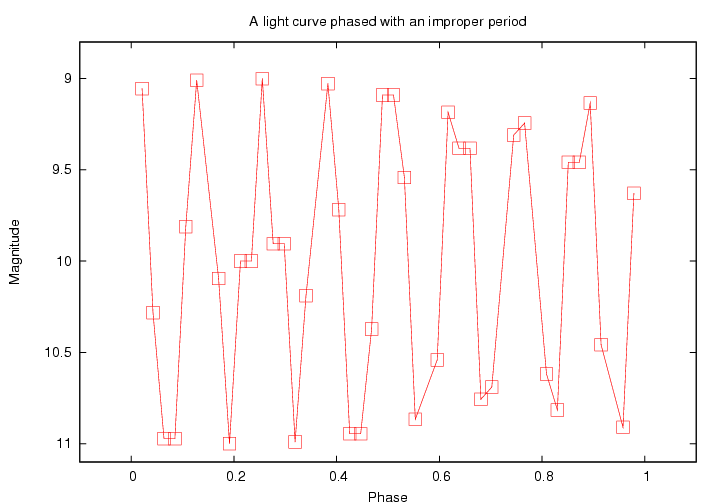
The basic idea is that if we plot the magnitude of a star as a function of phase, then if we pick the wrong phase, the light curve will bounce up and down a lot:

If we were to stretch a piece of string from point to point, just like the red lines connecting the dot in the diagram above, we would need a very long piece of string to cover the entire light curve.
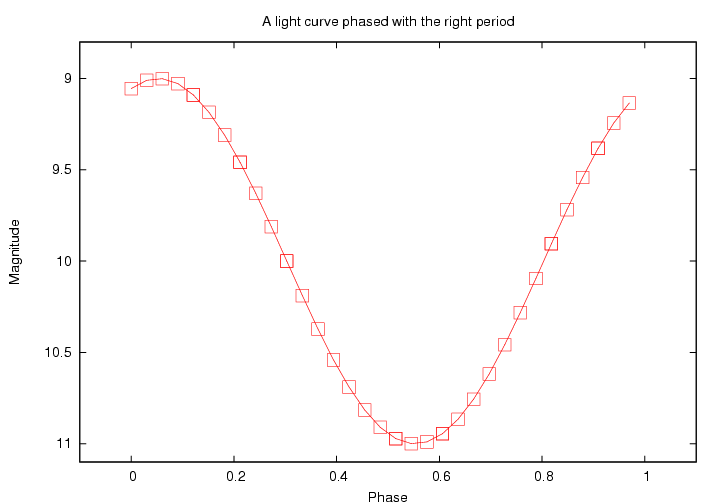
On the other hand, if we choose the proper period for the star, then the phased light curve looks much smoother:

Connecting the dots now requires a much shorter piece of string, because the segment from one phase to the next is always short.
One can use this technique to find the period of a variable star, following a pretty simple method:
For a large set of trial periods,
There are some details, such as determining whether a candidate period is likely to be real (even if it is the shortest); you can read the paper by Dworetsky for those details.
I've written some code to apply this technique to measurements of a star. The input should be a plain ASCII text file with columns of numbers separated by white space. The program looks for three particular columns:
If the uncertainty values are not available, the program will make a guess at the appropriate weights, using rules which are appropriate for SDSS measurements in r-band.
Invoke the program like so:
period tcol=1 mcol=3 ecol=5 lightcurve.dat
where
For example, for a very simple datafile like this one, called "curve.dat",
# date   magnitude   magerr
 2.34     10.945      0.023
 3.24      9.382      0.022
 4.29      9.459      0.019
 6.33     10.972      0.028
one would invoke the program like so:
period tcol=0 mcol=1 ecol=2 curve.dat
The program searches through a range of periods, using steps of constant size in frequency. You can change these limits by modifying the lines in the program which look like this:
   /* when we look for periods, use these as boundaries, in days */
#define MIN_PERIOD    0.10
#define MAX_PERIOD  100.00

    * or we can search in steps of frequency,
    *    using steps of this many cycles per day
    */
#define FREQUENCY_STEPSIZE  0.00010
In addition, the program also applies a special, bogus "period" of 9999 days to the measurements. For most datasets (less than 27 years in length), this will leave the measurements in chronological order, or, in other words, unphased. For very long-period variables, or objects which are not periodic, this may yield the shortest string length of all.
If all goes well, the program will print a single line to stdout. This line contains the following information in its columns:
There will be a maximum of 10 candidate solutions reported. In some cases, if the program judges that fewer than 10 solutions pass the tests for "likely-to-be-real-periods", it will report fewer than 10 solutions.
For example, if one runs the program on the sample datafile "generate_data.out" which is provided,
period tcol=0 mcol=1 ecol=2 generate_data.out
one will see the following output:
40 10 3.30797221 1.985 3.30578512 1.987 3.29380764 1.994 3.30687831 1.995 3.29272308 1.996 3.31016220 2.031 3.30906684 2.031 3.31125828 2.033 3.31235508 2.043 3.29706561 2.046
There are 10 reported solutions, sorted from shortest string length to longest string length. The best solution, a period of 3.30797221 days, yields a string length of 1.985 normalized units. Note that all the reported solutions have similar string lengths and similar periods, so one would probably need to discriminate among the possibilities using some other information.
For the special case of analyzing SDSS measurements, I have written a slightly modified version of this program. The modified version reads in three separate datafiles, representing measurements made in three different passbands (for example, g, r, i). It then walks through a large range of possible periods/frequencies, just like the regular program, but it computes three string lengths for each period:
It adds all three strings together to form a "total" length, giving equal weights to each string. This "total" length is then used in the usual manner to find the best periods/frequencies.
This program is invoked in exactly the same way as the regular period program, except that the user must supply THREE input files as the final arguments:
period_3 tcol=0 mcol=1 ecol=2 star_g.dat star_r.dat star_i.dat
The output of the program is exactly the same as the output of the regular program.
You can grab a tar file with the code and a single test file of sample measurements.
To extract the code, type
tar -xvf period.tar
To build the code, type
make all