 Copyright © Michael Richmond.
This work is licensed under a Creative Commons License.
Copyright © Michael Richmond.
This work is licensed under a Creative Commons License.
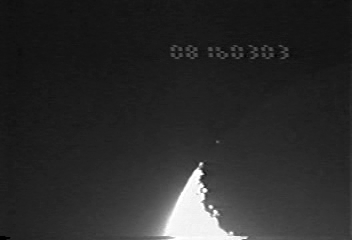
On July 15, 2001, Brad Timerson, near Dresden, New York, USA, observed the Moon graze the star 85 Ceti, also known as SAO 93067 = HR 797 = HD 16861. His equipment included
He kindly sent an MPEG version of the digitized video record to me. I processed it in the following manner:
The times on first and last frames in my set were
This yields a frame rate of 29.973 frames per second.
The star was not overwhelmingly strong. In the JPEG files I pulled from the movie, each pixel can have a value between 0 and 255 counts. The typical background near the star was around 40 counts. The star itself was not saturated, having a peak value around 120 counts. The FWHM of the stellar image was around 3 pixels. I estimate very roughly from the size of the Moon in the images that each pixel is about 5 arcsec on a side.
For each of the 7199 frames, I
There was a complication: in many images, the star itself was invisible, yet my software claimed to find an "object". These were noise peaks, I suppose. It is clear that there are a significant number of such false detections if one looks at the location of the "object" in all frames. In the graph below, I place a red dot at the (row, col) position of the detected "object" in all frames.
As you can see, the field of view drifted slightly over the course of the 4-minute video record. The real detections define a snake-like locus, with a big break where there was a prolonged disappearance. The individual points located far from this locus are false detections. To get rid of many (but not all) of them, I drew two lines, shown in the diagram above, and discarded any detection outside the lines.
I also found that the detections after frame 7100 were noisy, so I discarded them, too. That left me with 5219 measurements, most of which were either real detections or at least measurements at the proper location.
The photometry taken at the positions of these false detections gave me a useful bit of information: it showed the amount of light above background that an aperture placed on a random location would yield.
 aperture radius        max value of flux in empty aperture
    (pixels)                   (counts above background)
--------------------------------------------------------
       2                             63
       3                            145
       4                            209
       5                            250
       6                            302
---------------------------------------------------------
In my graphs below, I place a dotted line at a flux of 145 counts above background, to indicate a rough limit below which measurements are dominated by noise.
To gauge the precision of the photometry, I calculated the mean flux and standard deviation from the mean for each star over several intervals:
             interval            mean counts    standard deviation
-------------------------------------------------------------------
   1000  <  frame <  1400          385            95
   5600  <  frame <  6000          420            87
--------------------------------------------------------------------
In short, the precision of the photometry is pretty low: around 20 percent. Note that the V-band magnitude for 85 Ceti is about V = 6.3; it is marked in SIMBAD as a variable star, however, and I don't know what its magnitude was exactly at the time of the occultation.
Here are quick views of the results. I have placed a dotted green line at the level of false detections, to indicate a reasonable limit for trusting the measurements.
The entire light curve:
A closeup around the first brief disappearance:
A closeup around the second, prolonged disappearance:
A closeup around frames 3300 to 4200:
A closeup around frames 4000 to 5200:
A closeup around frames 5000 to 5800:
You can grab the data in a multi-column ASCII text file below. The columns are
 col              quantity
------------------------------
  1              frame index

  2,3            flux of 85 Ceti in 2-pixel aperture, and estimate
                     of uncertainty in that flux
  4,5            ditto 3-pixel aperture
  6,7            ditto 4-pixel aperture
  8,9            ditto 5-pixel aperture
  10,11          ditto 6-pixel aperture
Copyright © Michael Richmond.
This work is licensed under a Creative Commons License.