 Copyright © Michael Richmond.
This work is licensed under a Creative Commons License.
On May 20, 2005, the asteroid (772) Tanete passed in front of the star TYC 7380-00754-1 for observers in portions of the southern hemisphere. Dave Gault of Australia captured a videotape of the event with his 10-inch Newtonian and PC-164C videocamera.
As Dave noted, the wind was strong and the seeing was poor, so that the images of the stars moved quite a bit over the course of the recording. He found the the target star disappeared for about 8.5 seconds.
I decided to try to apply my photometry routines to the video in order to get some feeling for the scatter in the photometry. It turned out that this particular recording reveals the weaknesses of my routines and method of analysis. Oh, well, a learning experience.
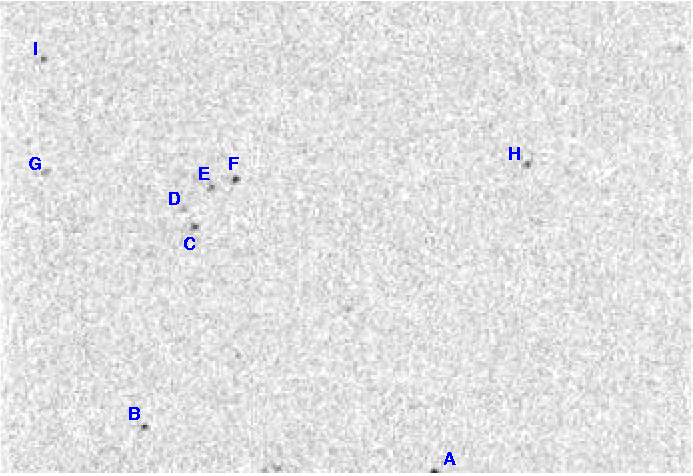
So, here's the field (this is a co-addition of seven frames):

The target star is marked "C" in the chart above. You can see, even in this co-added picture, the blocky residuals in the background caused by the compression in the original video recording. Dave placed an MPEG-1 movie of the recording on his web page, and (I believe) it was encoded at some relatively high compression. This means that the background pixels are not distributed in the usual random gaussian fashion, which makes detecting stars difficult and measuring their properties inaccurate. Strike 1!
I converted the MPEG-1 movie to a series of JPEG images, one per frame. There were 397 images in movie. The first 31 images had text overlaid -- I ignored them. I then converted the JPEG images to FITS format for further processing (and converted the 8-bit FITS to 16-bit FITS, too).
The stars are relatively faint. The scatter in background pixel values is roughly 5 DN, and the peak values of the stars are typically only 20 to 30 DN above the background. My code had a tough time finding more than the 2 or 3 brightest stars in most of the frames. Strike 2! To help it, I convolved each frame with a gaussian of FWHM=5 pixels before searching for stars; that tended to decrease the number of spurious detections while increasing the number of true stars found.
After I had found the stars, I measured their properties of the on the original, un-convolved images. Using circular apertures, I found that an aperture radius of 3 pixels gave marginally better results than radii of 2 or 4 pixels. So, I measured the instrumental magnitude of each star through a circular aperture of radius 3 pixels, subtracting a local sky determined from an annulus of radii 10 and 20 pixels around each star.
Now came the hardest part: trying to match up the detections of each star in the 397 images. Because the location of each star moved around so much, this was very difficult. Strike 3! I tried using my ensemble photometry package to align all the detections, but it didn't work very well; I think that the problems were caused by
After tweaking the parameters many times, I found that the best I could do was to settle on only 227 of the original 397 input images. I was able to build an ensemble of 10 stars in this subset of the images. So, note that 43 percent of the frames are missing from this analysis!
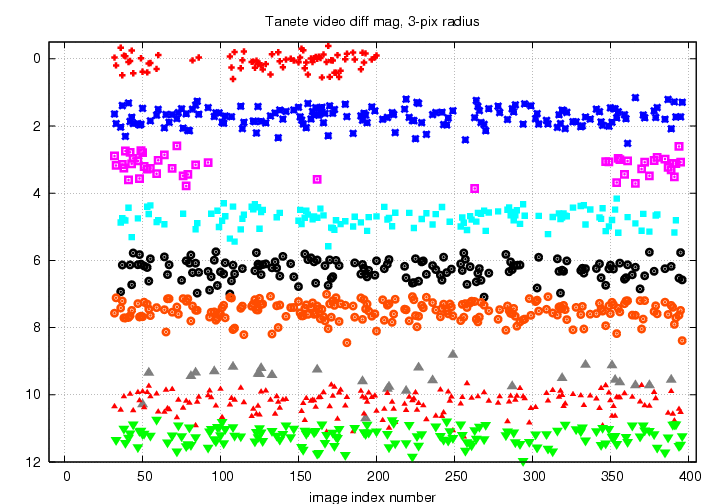
From this point, things were straightforward. I derived small frame-to-frame zeropoint adjustments. After applying them to the stars in each frame, I could calculate light curves for all the stars in the chart:

The stars in this plot go in alphabetical order from the top; I have added small shifts to the magnitudes to separate them in this diagram.
The typical scatter of each star from its mean magnitude was about 0.25 mag.
You can see that the target star C disappears around frame 92, is detected in two frames (162 and 263), then re-appears for good in around frame 347. The re-appearances may be real, or they may simply be instances where the background noise created a peak at the (invisible) star's position; I have not examined those frames very carefully.
I can also say nothing about the gradualness of the dis-appearance or re-appearance, due to the large fraction of frames missing from the ensemble.
Note that the range of frames over which the target star disappears from my subset is (347 - 92) = 255. At a rate of 29.97 frames per second, this corresponds to 8.5 seconds -- which is exactly what Dave Gault had concluded in his own analysis of the event.
The bottom line is that, in this case, there was really nothing gained by doing the photometry and ensemble solution. Dave Gault was able to determine the duration of the disppearance just fine by stepping through the tape. I can say less than he can, in fact, about the nature of the changes in brightness at each end of the occultation.
I think what I learned here is that visual examination of a tape is probably the best way to handle recordings with low signal and large motions. The human eye (and human mind) are very, very good processors of imperfect information!
 Copyright © Michael Richmond.
This work is licensed under a Creative Commons License.