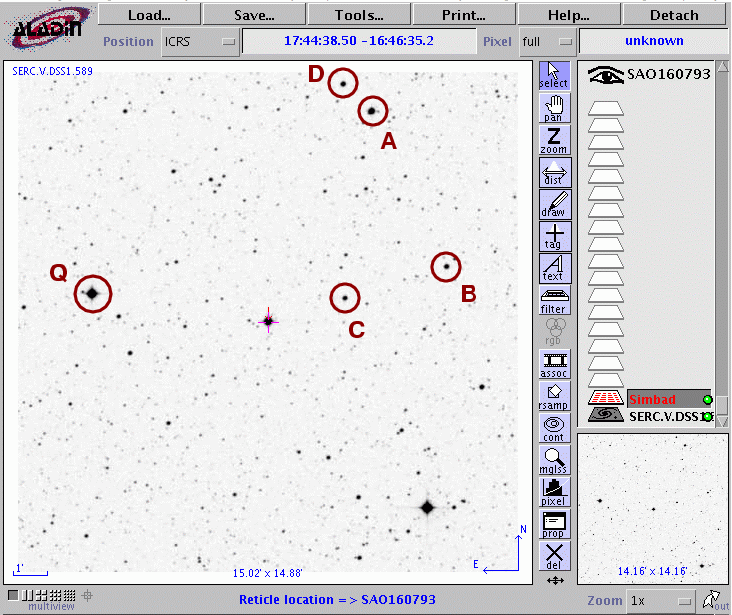
On UT 2007 Sep 27, Pluto passed very very close to the star SAO 160793 = HD 161154 at (J2000) RA = 17h 44m 38.39s, Dec = -16 deg 46' 35.2". John Grismore recorded the close approach, in case some material around Pluto (rings or a satellite) might dim the background star briefly.
Below is a chart from Aladin centered on the target star.
John observed the event from Bartlesville, Oklahoma, USA:
Latitude:  36 43 05 N
Longitude: 95 57 10 W
Meade 8-inch LX200R with Watec 902H2 Ultimate recorded to Sony CDR-HC42 miniDV
John original recordings include over 2 hours of images. He kindly sent a small subset of the entire data to me so that I could carry out an independent analysis.
I concentrated on a clip roughly one minute long, called clip18 on John's DVD. This clip contained 1800 individual images in the form an AVI movie file. I used the TMPGEnc program to break the movie into individual images. Each image I grabbed
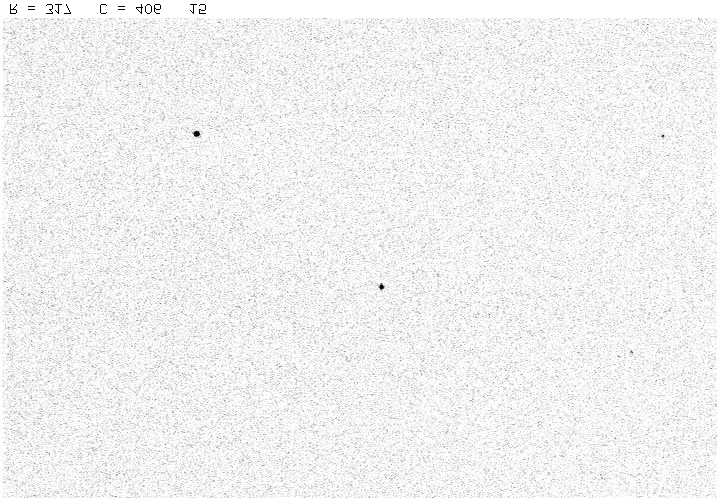
Here's one of the images: North is to the upper-left, East is to the lower-left, and the field of view is about 12 arcminutes on a side.
There's only a single star other than the target with any real signal in the individual images: SAO 160798 = HD 161227. This star is a bit brighter than the target star. Unfortunately, both of these bright stars were slightly saturated in the original images. What I mean is that the peak pixel values in the target star were very close to, or equal to 255, the largest value possible in the 8-bit digitized image. The situation was worse for the other star, HD 161227: its central 3 or 4 pixels were always equal to 255, giving the radial profile a flat central plateau. Because the peak pixel values are "cut off" at 255, the photometry we measure for these stars will be somewhat inaccurate, as you will see later.
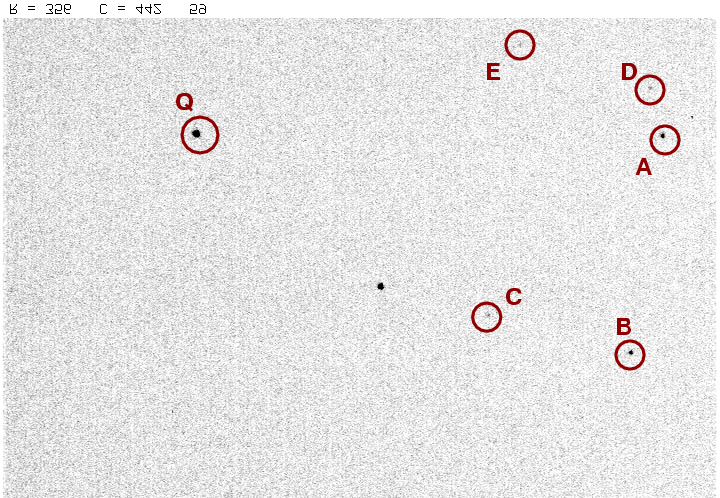
Some very faint objects can be seen in the images. In order to boost the signal-to-noise ratio of all objects, I co-added sets of 10 consecutive frames like so:
       original images  00  to  09    ---   coadded frame 1
       original images  10  to  19    ---   coadded frame 2
       original images  20  to  29    ---   coadded frame 3
            etc.
Below is one of the coadded frames, with some labels attached to identify the stars for future reference.
The Full-Width at Half-Maximum (FWHM) of the images was about 2.5 to 3.5 pixels. I measured the light from these (and all other detectable objects) in the frame using circular apertures of radius 3, 4, 5 and 6 pixels. I sent the photometry through inhomogeneous ensemble photometry so that I could use as many comparison stars as possible.
Now, I will present four versions of light curves for the target star below, based on four different sets of choices for the analysis.
We know that star Q is slightly saturated. If we allow its measurements to influence the ensemble zeropoints, we must suffer some type of added noise as a result. On the other hand, star Q is very bright ... so the random fluctuations in its brightness due to photon counts is small. As you see below, it's probably better to include it than not: the scatter in measurements of the target star is slightly smaller when we include Q.
Below are graphs showing the light curves of all the marked stars, plus the target star. Note that the scatter in the measurements is smallest for the bright stars (near the top of the graph) and larger for the faint stars (near the bottom).
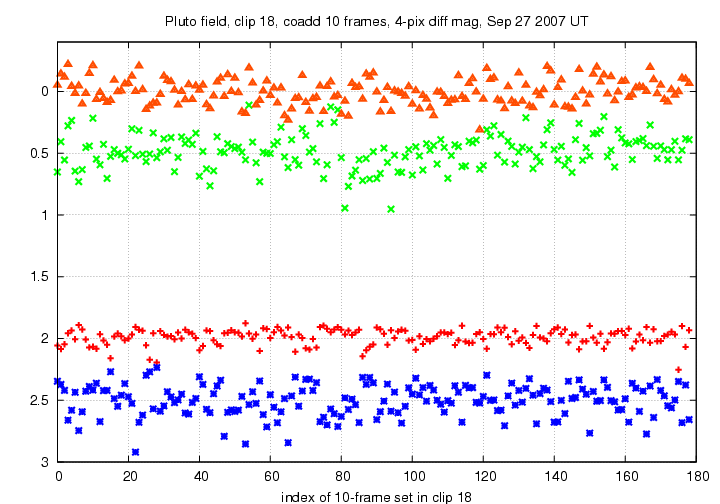
Option 1a: include Q as a good star, use 4-pixel aperture. Notice how flat the light curve of star Q (orange triangles) is: that's no surprise, as it is so bright that it dominates the ensemble solution. In essence, we are using Q as a fixed, single comparison star.

Option 1b: include Q as a good star, use 5-pixel aperture. This is almost identical to the previous graph -- so modifying the aperture size has no big influence on the results.
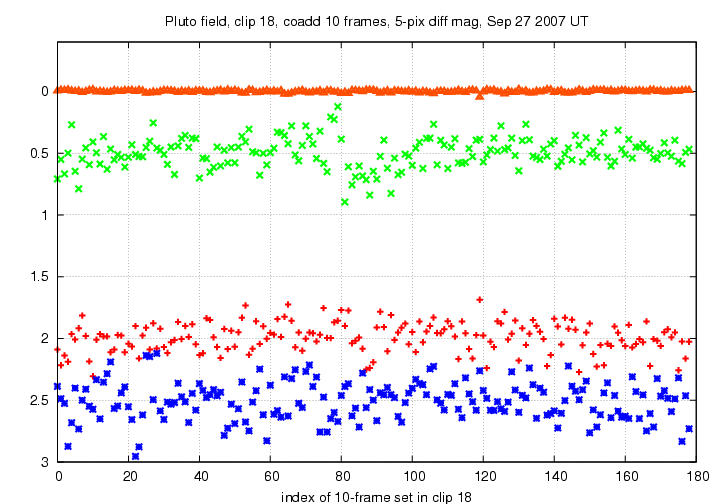
Option 2a: mark star Q as a "variable", so that it doesn't influence the ensemble solution, and use 4-pixel aperture. In this case, the brightest stars left to act in the ensemble are A and B. Each one is signficantly fainter than Q, so the "random" fluctuations are larger in the ensemble output.
Option 2b: mark star Q as a "variable", use 5-pixel aperture. Again, very similar to the 4-pixel result.
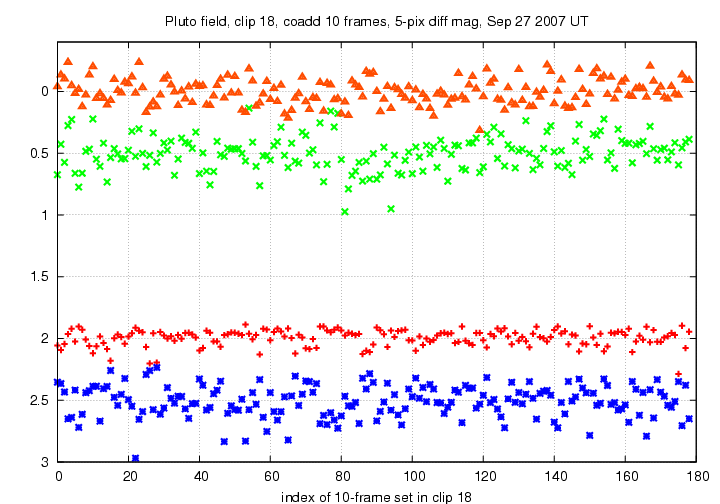
In every graph, you see a "feature" near index 80: the light from the target star rises up above the usual level for 3 frames, then dips below the usual level for maybe 7 frames. Does this "feature" correspond to a real change in brightness due to starlight passing some object in the vicinity of Pluto?
To answer that question, one would need to have a good statistical sample of the light in the coadded frames. My short sample of just one minute yields about 180 coadded frames; that's not really enough, I think, to measure means and standard deviations and medians and so forth. My guess is that this "feature" is just random noise, but that's only a guess. If someone wants to coadd frames during the entire 2-hour recording, he could then make some strong statistical statements about the likelihood that this "feature" might arise by chance.
I provide below the differential photometry of the target star in ASCII format: the interesting columns are
   col 4:   coadded frame index number
   col 7:   ensemble magnitude of Pluto-plus-star
   col 8:   estimate of uncertainty in magnitude
If you are interested in the differential magnitudes of the other stars, contact me by E-mail or via the Yahoo IOTAoccultations group .