Executive Summary:
On October 3, 2006, asteroid (25) Phocaea occulted the bright star SAO 108610. I set up to observe the event from the RIT Observatory:
  Latitude +43.0758 degrees North = +43:04:33
  Longitude 77.6647 degrees West of Greenwich = 77:39:53 W
  Altitude 168 meters

  Meade LX200GPS 12-inch f/10 Schmidt-Cassegrain telescope
  PC164C CCD video camera
  Kiwi OSD GPS video time inserter
  Garmin 16 GPS
  random old VCR
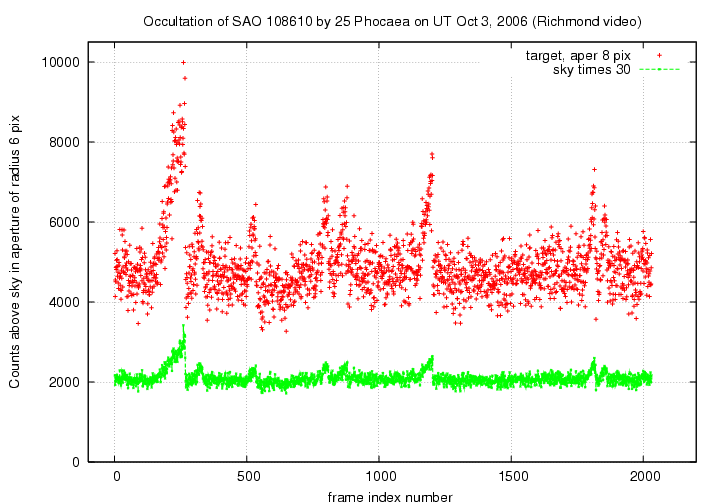
The conditions were good, but I saw no dip in brightness on the TV monitor at the predicted time. Later, I fed one minute of video around the predicted time through a Canopus ADVC 110 to digitize it. When I analyzed the individual frames, I found a strange light curve:

There is certainly no dip, so this confirms my conclusion that there was no occultation. The spikes in brightness are wierd. Note that the brightness of the sky mirrors that of the star, which rules out the passage of thin clouds as an explanation: they would make the star dimmer and the sky brighter.
My guess is that these variations are due to changes in the gain of the camera, but I don't know why the gain should have been changing so much ....
Brad Timerson made a video record of the event from his location in Newark, NY:
Latitude:   43 d   00 m   24.0 s   North
Longitude:  77 d   07 m   06.0 s   West
Altitude:  144 m

   + 51 km from the predicted path
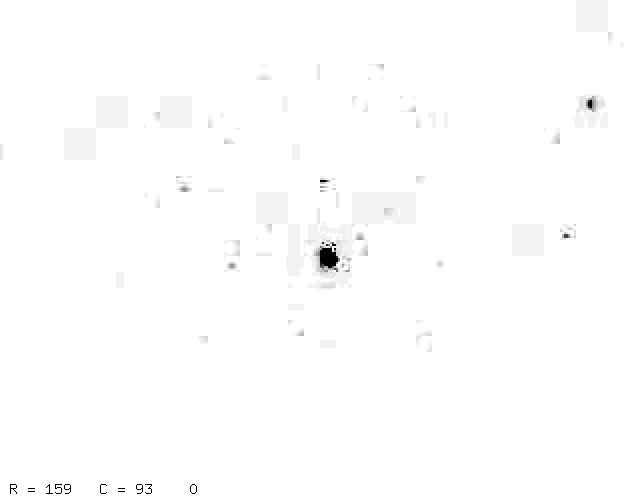
Brad sent me a (possibly low-quality) digitized copy of his video record, so that I might do an independent analysis of the event. Here's a sample frame from the movie. Note the compression artifacts. The target is the bright object at the center. You can see a faint comparison star near the top right corner.
The bright target star is saturated when it is not being occulted, as this radial profile shows:
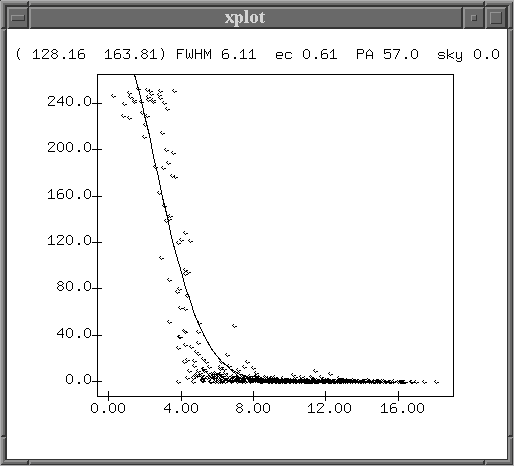
That means that our photometry will underestimate the actual brightness of the unocculted star, and so underestimate the depth of any occultations.
I followed my usual procedure:
I decided that the large, 10-pixel radius yielded the best results. Here are my light curves of the target star and the comparison star from the entire movie clip.
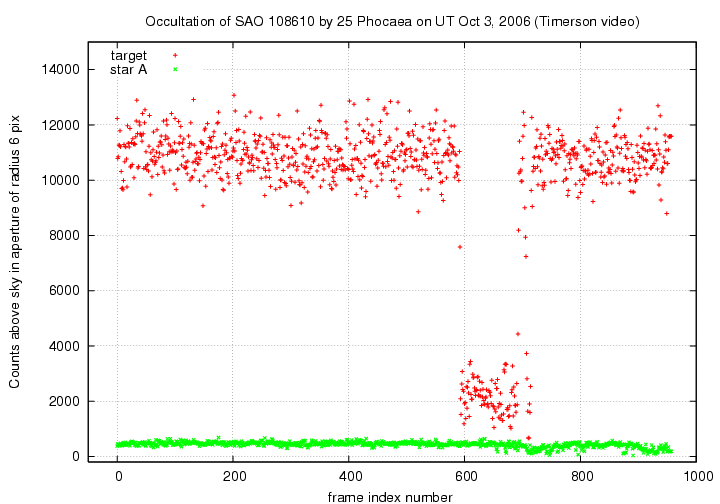
Now let's look at a closeup around the time of the occultation. I multiply the measurements of the comparison star by a factor of 15 so that they run through the middle of the graph.
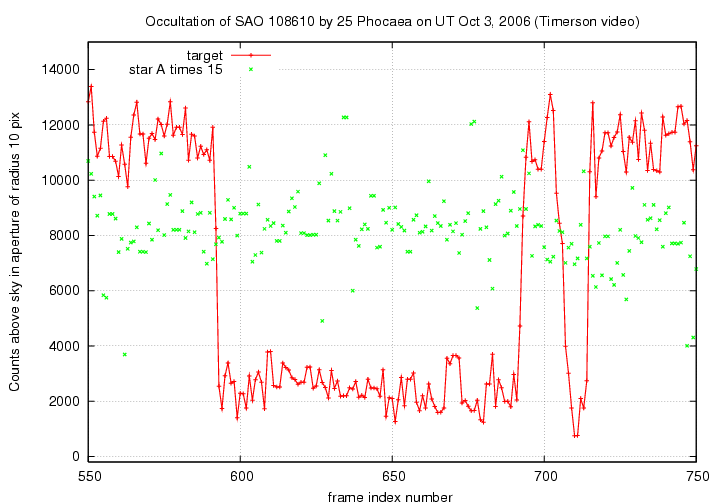
There are two clear events: a long first disappearance, followed by a brief second dip. Of the four changes, three occur very quickly (lasting only 1 or 2 frames), but the second disappearance is more gradual (lasting 4 or 5 frames).
The pattern here is very similar to that measured by Brad Timerson with the LiMovie software. Every little rise and fall is mirrored in the two independent analyses:
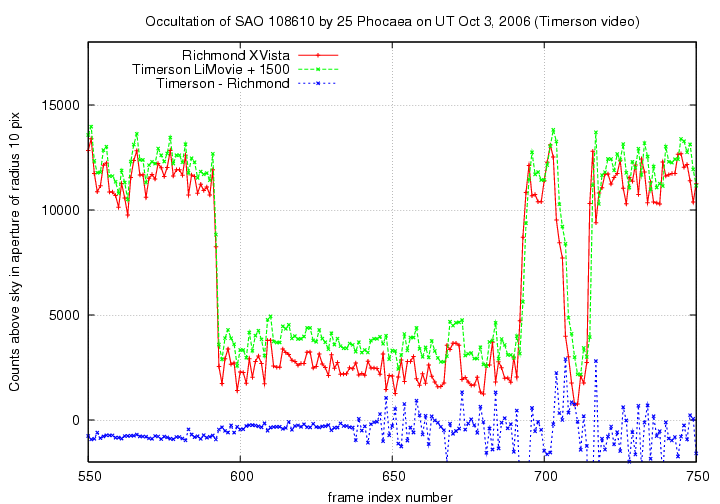
Well -- almost. On the graph above, I show in blue the difference between the two measurements of the target star, frame by frame. Around frame 640, the differences change from a smooth curve to a jagged one. Why? Because my light curve falls one frame behind Brad's. Note how both light curves agree exactly on the time of D1, but the red curve lags behind by one frame for the other three events.
If I insert one dummy value at frame 640 into my light curve, pushing all the others ahead by one frame, then the difference remains smooth and the curves remain in sync for the entire clip:
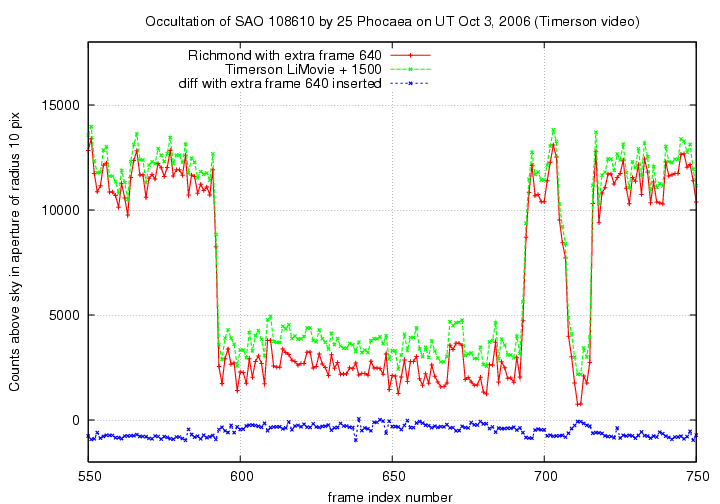
The question is: where did the extra frame go? Did an error occur when I broke the movie clip into frames (dropping one around 640), or did it occur when Brad broke his original clip into frames (adding one extra around 640)? The answer is I don't know (though I suspect the error is mine).
If the video had a time inserted into it, then the timestamps would reveal where a frame was dropped, or added. If the video had an audio track with regular, frequent time signals, one might be able to find the extra (or missing) frame by counting carefully between the time signals. But, with the information at hand, it's really hard to know what happened.