 Copyright © Michael Richmond.
This work is licensed under a Creative Commons License.
Copyright © Michael Richmond.
This work is licensed under a Creative Commons License.
Table of contents:
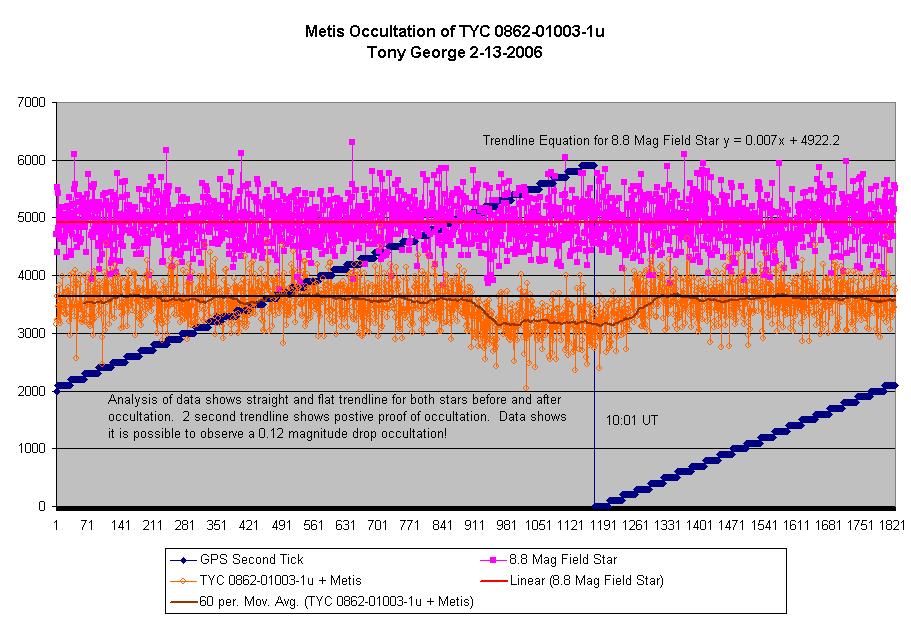
Tony George observed the asteroid (9) Metis occult the star TYC 0862-01003-1 on UT Feb 13, 2006. He watched from his driveway in Umatilla, Oregon, near latitude +45.9336, longitude 119.2986 West. His equipment included
  Meade LX200GPS 12-inch Schmidt-Cassegrain telescope
  Meade f3.3 focal reducer
  PC164C CCD video camera
  STVAstro GPS video time inserter
  Garmin 16 GPS
  Canon ZR50 Mini DV tape recorder
Tony has analyzed the videotape using LiMovie, going field-by-field (each field is 1/60 of a second). He found evidence for the occultation, even though its amplitude was small -- about 0.1 magnitudes:
Tony asked me to examine the video, just to confirm his measurement.
Below is a picture which represents 100 coadded images.

I have added some labels to aid in identifying the field. In this picture, you can see the bright asteroid Metis just to the south-east of the star it will occult in about 20 minutes. The bright star marked "A" to the south-west is HD 99123, a K0 star with V=8.73. I will use this star as a reference source.
Compare the chart to a section of the Digitized Sky Survey below, which is 14 arcminutes on a side:
In order to prevent saturation and provide a higher signal-to-noise ratio, Tony threw the image slightly out of focus. Here's a single frame near the time of occultation, showing that the light from each star is spread out into a big donut. The radius of each donut is about 8 pixels.
I analyzed a video file containing 2157 frames, which covered a period of 71.938 seconds; the derived frame rate of 29.970 frames per second indicates that I didn't drop any frames in the translation. The first frame in this clip corresponds roughly to UT 09:59:58.50. Tony can provide much better information on the times since he has analyzed the video stream field-by-field.
First, I broke the video clip into individual frames, using MPlayer. The result was a set of JPEG images, each 720 x 480 pixels in size. Each frame had a KIWI OSD timestamp at the bottom. My analysis used frames, composed of two superimposed fields, so the timestamp was a blurred version of the stamps on two consecutive fields.
In order to process the data, I
There was only a single bright star visible in the individual frames. I chose the brightest, HD 99123 = "A" in the charts above, as a primary reference. I also chose a region of "empty sky" about 40 pixels away from the target star; if all goes well, it will produce zero integrated light.
For each of the frames, I
Here are quick views of the results. I decided that the aperture with radius 4 pixels gave the best results, so I show them in the plots below. You can find measurements through two other apertures in the table at the end of this section.
First, the entire light curve, using an aperture radius of 10 pixels around each position.
Note that the target star does dip in brightness for an extended period near the end of the record. One must use an aperture large enough to cover the entire donut in order to see the event clearly. Below, for example, is a plot using photometry based on an aperture of radius 8 pixels; the event is harder to see.
I'll use the 10-pixel photometry from now on.
I applied a moving 10-frame boxcar average to the measurements. The event appears very clearly in this smoothed version of the light curve:
Now, let's zoom in on the event.
I agree with Tony's conclusion: the asteroid occulted the star. Since the asteroid was much brighter than the star (which has magnitudes Bt=12.4, Vt=11.8), the combined light decreased only slightly:
when       frames         Metis + star counts
----------------------------------------------
before     1400-1500         3498 +/- 291

during     1700-1800         3081 +/- 273

after      2000-2100         3474 +/- 270
----------------------------------------------
This rough calculation indicates a dip of about 12 percent in the combined light. I leave it to others to determine the times at which the occultation started and ended.
You can grab the data in multi-column ASCII text files below. The columns are
 col              quantity
------------------------------
  1              frame index

  2,3            flux of reference star "A" in 6-pixel-radius aperture,
                     and estimate of uncertainty in that flux
  4,5            ditto 8-pixel aperture
  6,7            ditto 10-pixel aperture

  8,9            flux of empty region in 6-pixel-radius aperture,
                     and estimate of uncertainty in that flux
 10,11           ditto 8-pixel aperture
 12,13           ditto 10-pixel aperture

 14,15           flux of target star in 6-pixel-radius aperture,
                     and estimate of uncertainty in that flux
 16,17           ditto 8-pixel aperture
 18,19           ditto 10-pixel aperture
Copyright © Michael Richmond.
This work is licensed under a Creative Commons License.