 Copyright © Michael Richmond.
This work is licensed under a Creative Commons License.
Copyright © Michael Richmond.
This work is licensed under a Creative Commons License.
Mar 16, 2006: New material added at end: analysis by Jean Lecacheux
Executive summary: photometry at the telescope's native f/10 focal ratio appears slightly better than photometry at shorter ratios. There is little or no difference in limiting magnitude.
Table of contents:
Derek Breit decided to test the effect of focal reducers on the depth and quality of video photometry. On the night of Feb 14, 2006, he set up his equipment:
You can read about Derek's plan in his posting to the IOTAoccultations Yahoo group:
The plan was to observe a set of targets at the three different focal ratios: the telescope's native f/10, and at f/6 with one focal reducer, and at f/3 with the Mogg focal reducer. How would the focal ratio affect the limiting magnitude? How would it affect the quality of photometry in a video recording?
Derek recorded data on a VHS video tape and mailed it to me. I digitized very small snippets of just a few seconds for several targets and analyzed the digital images.
Let me show briefly some pictures of Saturn and its moons. At this time, the moons were arranged like so:
The moons of interest are:
 chart ID    name        approx mag
-------------------------------------
   I        Mimas           13
  II        Enceladus       11.8
 III        Tethys          10.3
  IV        Dione           10.2
   V        Rhea             9.8
  VI        Titan            8.4
 VII        Hyperion        14.3
------------------------------------
Let's start with the f/3 image. Titan is the brightest object, to Saturn's upper left. Dione and Tethys are the faint moons flanking Saturn on the left and right, respectively, while Rhea is (in this view) almost hidden in the glare just above the ball of the planet.
Note the rolling gradient in the image: faint on both sides and brighter in the middle. This same pattern appears in some frames taken when the camera was off the telescope (and sitting on a table?), when I suspect no light was entering it. I believe this is a variation in the "dark current" of the camera. I will address this later when discussing results in M35.
The f/6 image zooms in a bit, so that Rhea is clearly separated from the planet's glare. No fainter moons appear.
The f/10 image zooms in even further.
However, there is still no sign of the faint moons Enceladus (II) or Mimas (I), as this insert shows.
I looked in detail at the bright moon Titan. In theory, the light from this object (and all objects) should be spread out more at large focal ratios than at small ones. Let's see if that happens ... I made a radial profile around the centroid of the light distribution and fit a circular gaussian to it. In the graphs below, the points represent individual pixel values after the local sky has been subtracted. The local sky value is shown at the top right corner of each graph.
First, let's compare f/3 (on the left below) and f/6 (on the right below) profiles. As expected, the FWHM is a bit smaller at the smaller focal ratio. However, the peak value is larger at f/6 than at f/3, which should not occur if the same amount of light is being spread out over a larger area on the chip. In fact, the total amount of light in the video frame seems to be larger in the f/6 image ... puzzling.
Now, let's compare f/3 (on the left below again) and f/10 (on the right below). The wide band of points around the fitted line in the f/10 profile indicates that the focus was not very good (or the PSF was not symmetric). Once again, we see that the peak value is larger at larger focal ratio ... which is puzzling indeed.
To first order, I guess, the PSF didn't change very much with focal ratio. If one looks closer, at the level of 20-30 percent, one facet of the results is almost the opposite of what one might expect: why should the camera record more counts in each pixel at a longer focal length? I guess it's possible that the f/3 focal reducer might be absorbing or scattering more light away from the core of the PSF than the f/6 or f/10 systems ... but I just don't know.
The open cluster M35 is relatively rich and contains stars as bright as about magnitude 8. This chart from the POSS I (made with the excellent Aladin tool ) shows an area about a quarter of a degree on a side, which is roughly the field of view at f/3.
I will concentrate on the string of stars in the northern section of this field:
I found photometry for these stars in two sources.
Here's a table of measurements for these stars:
# magnitudes for stars in M35,
#   taken from Sung and Bessell, MNRAS 306, 361 (1999)
#   except for stars A and B, which come from Tycho-2
#   a value of 99 means "no data"
#star      B        V        I        B-V     V-I
A         8.876    7.546   99.000    7.546    1.330
B         8.229    8.194   99.000    8.194    0.035
C         9.044    8.960    8.812    8.960    0.084
D        10.108    9.981    9.807    9.981    0.127
F        11.338   11.160   10.902   11.160    0.178
G        11.154   10.961   10.707   10.961    0.193
I        10.418   10.212    9.907   10.212    0.206
O        10.669   10.453   10.171   10.453    0.216
P        11.428   11.218   10.921   11.218    0.210
Q        11.895   11.674   11.373   11.674    0.221
By the way, note that M35 is not an ideal object for testing photometry because most of the stars in it fall along a main sequence: as the stars go from bright to faint, they also gradually and simultaneously change color from blue to red. That means that errors caused by different brightness may become confused with errors caused by different colors.
So, let's see how this cluster appears at different focal ratios. As before, I'll start with f/3, then f/6, then f/10. I have subtracted a median dark frame, based on 50 dark frames, from all the M35 data. I have also set all the pixels in a box around the timestamp to zero. Each of the pictures shown below have been displayed with identical contrast: pure white corresponds to -10 counts, and pure black to +80 counts.
Below is the view at f/3.
Next is f/6.
And finally f/10.
Based on the distance between stars A and B, I derive the following plate scales and fields of view for these images.
  focal ratio      plate scale        field of view (720x480 pixels)
                  (arcsec/pixel)           arcsec         arcmin
-----------------------------------------------------------------------
     f/3            1.945               1400 x 934       23.3 x 15.6

     f/6            1.130                814 x 542       13.6 x  9.0

     f/10           0.701                505 x 337        8.4 x  5.6
-----------------------------------------------------------------------
How deep does each image go? Let's look at a closeup around star B in each image. Here are cutouts from the images at their original scales.
Below, I've tried to expand the f/3 and f/6 cutouts to roughly the same scale as the f/10 cutout.

It seems to me that the depth of all three images is about the same. All show the stars "Q" and "P" faintly, for example, and none show any of the fainter stars between "B" and "P".
We can be a bit more quantitative. I used some of the programs from the XVista suite to find stars in all the images grabbed at each focal ratio.
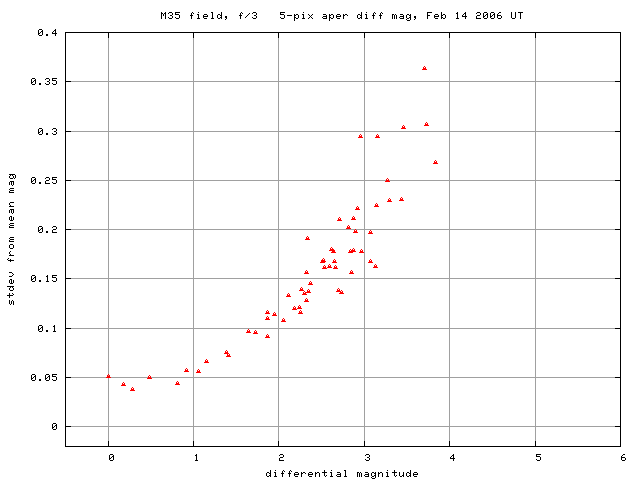
I measured the brightness of each star via aperture photometry, using an aperture of radius 5 pixels and a local sky annuli with inner radius 10 pixels and outer radius 20 pixels. I then followed the methods of inhomogeneous ensemble photometry to create a global solution for the instrumental magnitude of each star; one byproduct is a measure of the scatter in magnitude from frame-to-frame. Below are graphs showing the scatter as a function of instrumental magnitude. The brightest star, with instrumental magnitude 0.0, is the star "A" in each case.
First are the ensemble results at f/3. Note that even the brightest stars vary by about 0.05 mag from frame to frame.
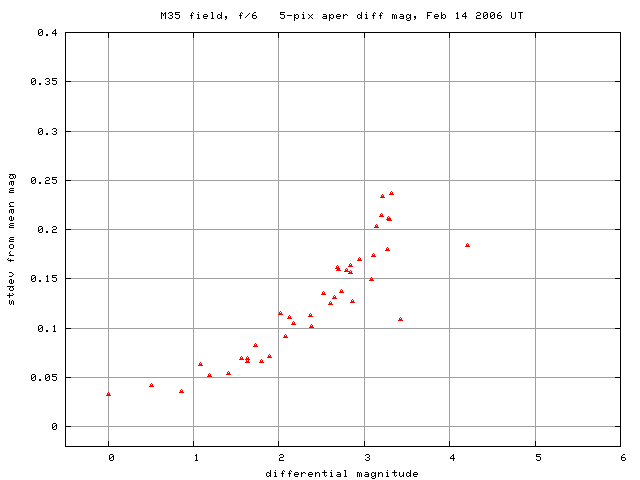
Next, the ensemble results at f/6.
Finally, the ensemble results at f/10.
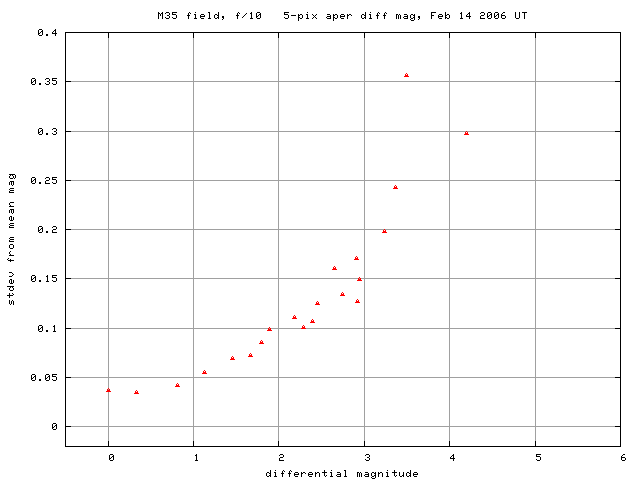
I would conclude that there is not much change in ensemble photometry as a function of focal ratio. The quality is slightly better at longer focal lengths, but only by a small factor.
Ensemble photometry asks "how CONSISTENT is the photometry from frame to frame?" But one may also ask, "how ACCURATE is the photometry?" One problem with this particular dataset is that it was taken unfiltered (I believe), and so can't be compared very well to published photometry in the standard passbands. Nonetheless, I'll compare the instrumental measurements from the video to V-band and I-band measurements of stars in the field.
On the vertical axis of each graph below I will place the difference delta = (instrumental mag - catalog mag) for each star. If the video measurements matched the catalog measurements perfectly, all the points would lie on a horizontal line at delta=0.
First, I'll compare the measurements taken at f/3 to published magnitudes, both V-band and I-band. I'll use the star "C", which was relatively bright but far from saturation in all images, to set the zero-point. Recall that there are no I-band measurements for the two brightest stars, "A" and "B", and that their V-band magnitudes were taken from a different source.
Hmmm. The f/3 results shown above suggest that something is wrong with the measurements of the bright stars "A" and "B". This could be
Let's look at the f/6 results. They show a similar pattern for the brightest stars. The fainter stars look pretty good, except possibly for the faintest star in V-band.
The differences in photometry measured at f/10 is shown below. Same old pattern.

In each case, it appears that over a range of about 2.5 magnitudes, the video frames provide reasonably accurate measurements of V-band or I-band magnitude. By "reasonably accurate", I mean "to within +/- 0.10 mag or so." This particular dataset does not give us enough information to find definitive evidence of saturation and/or non-linearity, though it provides a hint.
Finally, let me plot the delta values for different focal ratios (and I-band only) on a single graph. Will one particular focal ratio stand out as providing more accurate photometry than the others?
Hmmm. Not really.
I have read your analyse of Derek's last Feb.14 video tests.
Indeed very interesting !
I first used the Titan-Tethys distance according to the "Horizons" ephemeris, and taking into account the rectangular pixel shape, I obtained good agreement with your scale determinations. The true f/d seemed 8.85, 5.4 and 3.1. From the 8.85 value instead of the 10 nominal, I guess that Derek put his camera just at opening of the Cassegrain hole.
(Jean created two new figures of Saturn to emphasize very faint objects. The first shows the field at f/3, the second at f/10. MWR)

I note that the variable satellite Iapetus (V ~11.4 at that time ?) is visible near Titan at any f/d, but that a nearby V= 11.6 white star (GSC 1395 1987, included at f/3 only) does not appear, or else appears very faintly. A limit of magnitude below 12.0 seems a poor performance for a 30-cm telescope with a f/3 reducer, especially when 2 or 4(?) frames are co-added.
My first question :
Q1: Could the camera gain be lowered automatically by Saturn's glare ? (as yet I noted this effect with my 8" f/4 telescope and my WAT902H)
(This is possible, I guess; it would depend on the details of the camera's software. My guess would be that the camera changes its gain based on the entire light coming from all parts of the frame, and not just the tiny ball of Saturn near the center, but that is just a guess. This is easy to check, though: point at Saturn or some other small, bright, source, and take several seconds of data. Then move the telescope slightly so that the bright source falls just outside the field of view, and take several seconds more of data. Compare the pictures taken with the bright source inside and outside the field. MWR)
Another question :
Q2: Are you sure that Titan at f/6 (or 5.4) and at f/3 had no saturation at all ? And even at f/8.85..., why not ?
(No, I'm not sure of this at all. As Jean goes on to show below, there is decent evidence that Titan was bright enough to push the camera into its non-linear zone, and perhaps cause some bleeding. MWR)
Indeed Titan and your "B" star in M35 have similar brightness : V= 8.0 for Titan, V= 8.2 for the star. Moreover the star is very blue (B2V) when Titan is reddish, what should increase Titan's relative response. Core saturation in the Titan profile should increase its apparent FWHM.
To test this idea, I copied your sat_f10.gif and measured it with an astronomical image processor. When I obtained FWHM= 6.7 for Titan (or 7.1 horizontally), so confirming your FWHM= 7.0 result, I found 4.7 for Thethys, 5.2 for Rhea, 4.8 for Dione, 4.6 for Iapetus. So it seems there are two extra pixels across the profile of Titan, as if the diameter measured at half height of its signal actually were at fourth height of the luminous spot. [Note: The 1.3 pixel diameter of Titan's physical disk here has only marginal incidence, due to the quadratic combination of convoluted diameters.]
Also I found 193 uf (units of flux) atop Titan's profile, i.e. 76 % of the real saturation at 255 uf. We guess that above the 50 % level, the charges begin overflowing into the antiblooming channels. So only a severe saturation (like on Saturn) might boost the signal up to a 255 uf saturation plateau.
Clearly, if my hypothesis is true that some significant saturation already happened at f/8.85, then more and more took place at f/5.4 then f/3.1, so explaining the always growing FWHM (when expressed in arc sec., not in pixels).
Possibly ~ 4.7 pixels (or 3.25 arc sec.) was the true FWHM of faint star in the f/10 case. But poor collimation of the telescope (coma) seems revealed at f/10 by both Titan and M35 images. It may result that the real seeing (atmospheric) might have been closer to 2 arc sec. than 3 arc sec.
Also I guess that some chromatic aberration could blur unfiltered images at f/6 or f/3, if the focal reducers were used without any infrared blocking. That also could enlarge the FWHM efficiently. For example at f/3 if the optical system was casually well-focused for near-IR light (near 700 nm), poor focusing of white (i.e. IR poor) sources as the GSC star or Enceladus could have resulted. I note that the reddish Iapetus seems have a well-peaked core instead.
Copyright © Michael Richmond.
This work is licensed under a Creative Commons License.