On August 2, 2006, Derek Breit posted a message to the Yahoogroups IOTAoccultations section, asking for help in analyzing a short group of video frames he had taken.
Derek provided some details of the observation:
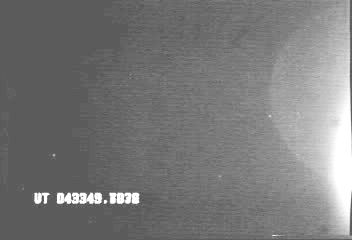
This is a video I shot last night with the Watec 802h on a 60mm Celestron (to see if I can use this setup for the beta Tauri Graze – See Below). This short clip contains an excellent pass of a satellite. Could someone extract the following information from a frame? What is the FOV? There are two main stars in this image, the one at lower left by the satellite, and the one by the lunar limb. The former is TYC 6143-0183-1, the latter is TYC 6142-0939-1. Are there any optical aberrations apparent? This was shot straight thru with a mogg FR set for “f6”. It would not focus at “f10” Is this a full range image, or do the image intensities go up in steps? I changed the method of copying from Video to DVD and have done little else to the video. I have yet to get a full range image for another project.
Here's what I did:
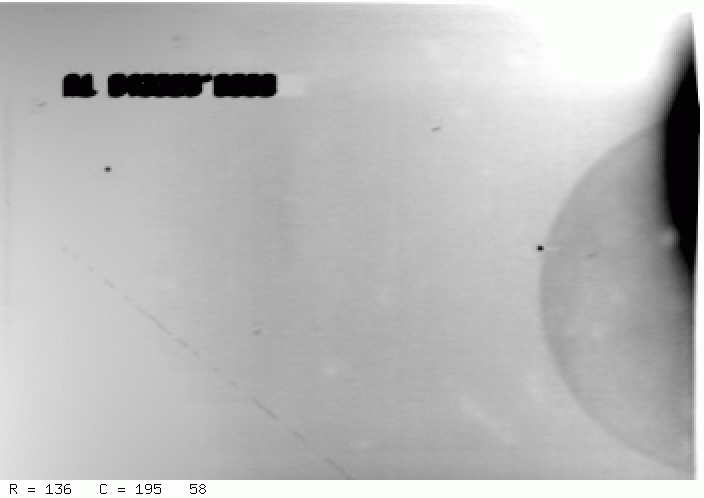
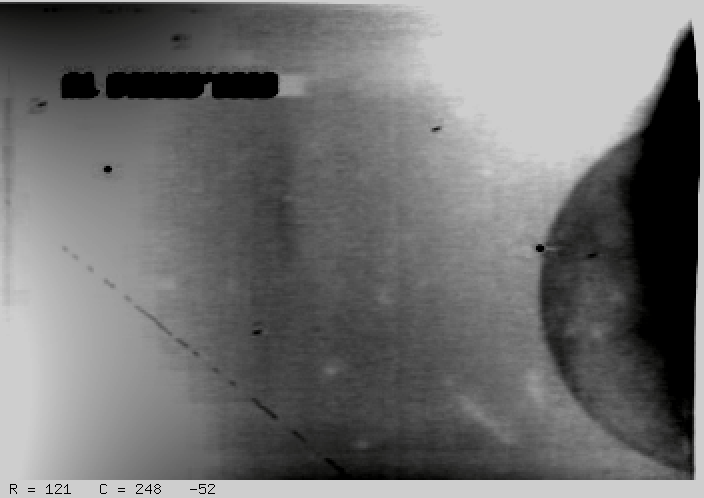
Here's one of the original frames from the movie. Note the very strong gradient across the image, caused by the Moon at the right edge:
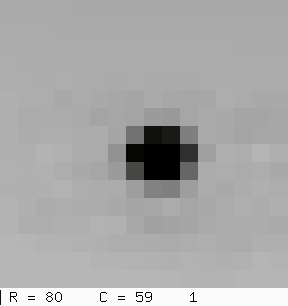
My first step was to add together the 78 frames. One way to do this is simply to stack all the frames, adding together the counts at each pixel location. Below is the result. I've flipped the image vertically from its original orientation, zoomed in by a factor of two to show details more clearly, and inverted the colormap. All following images will have this same orientation and size.
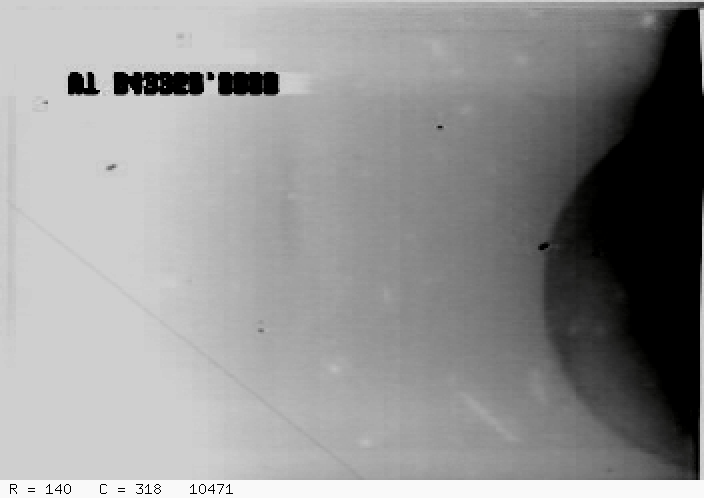
There are two types of "bright spots" on the image: two real stars, which appear slightly trailed due to tracking errors during the duration of the movie; and camera defects, hot spots, which appear sharper since they are fixed on the focal plane.
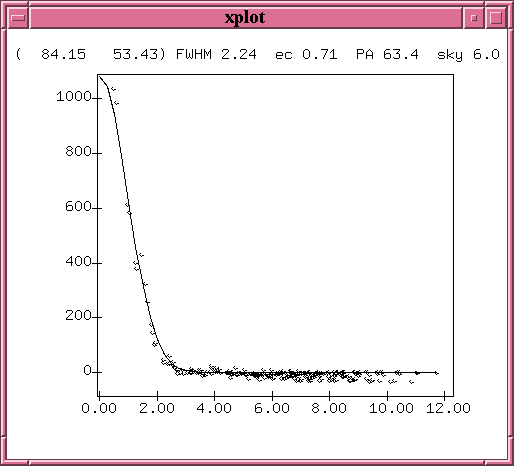
In order to see the stars clearly, I zoomed in on the star at left and measured its position on all 78 frames; then I used the shift in its apparent position to compute the offsets necessary to keep the stars fixed in place for future image stacking.
Using the shift-and-add technique, we get the stacked image shown below. The first version has soft contrast, the second a harder stretch to show fainter details.
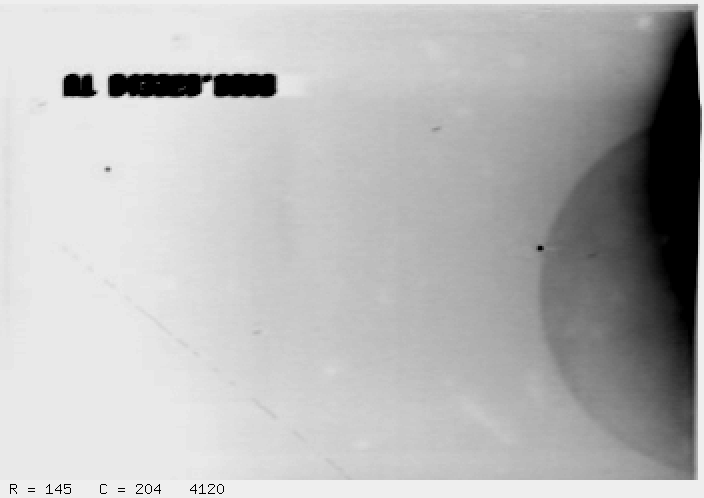
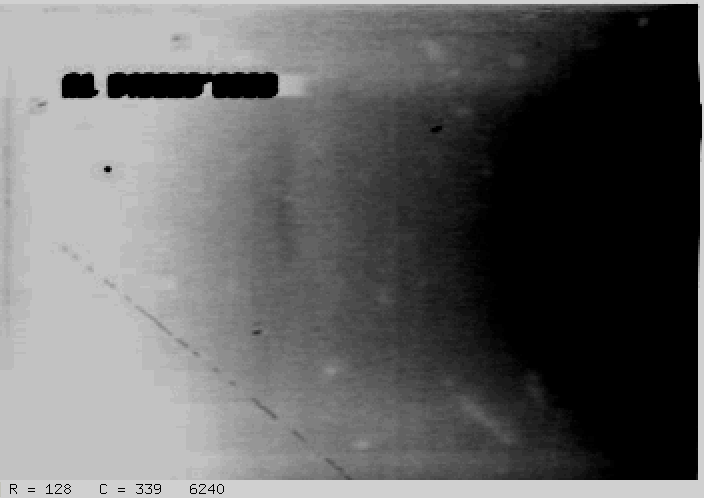
The stars are now nice and round, while the camera defects appear trailed. Fine.
Let me use this image to answer some of Derek's questions:
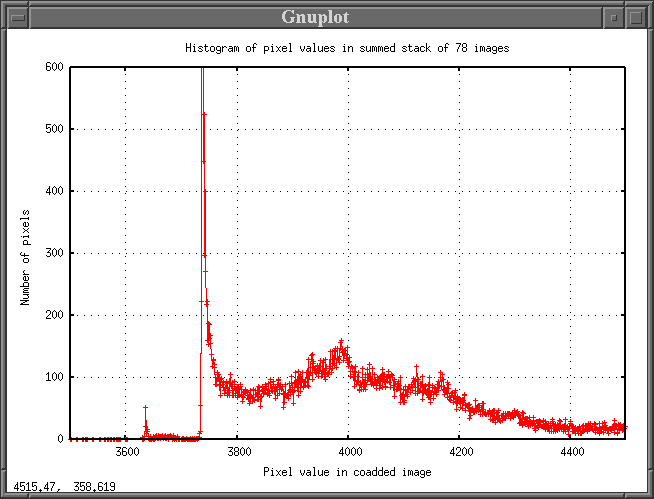
Some techniques for stacking video frames leave large steps in between pixel values. To check, one can make a histogram of pixel values in the final image. Below is a section of the histogram for my stacked image. As you can see, there are no gaps between adjacent pixel values once we enter the region of the background sky. So, with the method I have described, one ends up with the full dynamic range possible in the coadded image.
The strong gradient from the Moon's light makes details hard to see. To get rid of it, I made a model of the sky background using a quadratic function in each direction (rows and cols), and subtracted it from the coadded image. The resulting image isn't flat -- there are still lots of regions where the background changes rapidly -- but it does show some faint details pretty well.
If you want to play with the images yourself, you can grab them below; each is a 16-bit integer FITS file.