In a thread on Sons of the Sam Horn website , Mr. Ripley wrote about The Meaning of Yaz. In the posts that followed, a number of people mentioned how Yaz carried the 1967 Red Sox team to the pennant, especially in the final six weeks of the season.
I was a bit too young at that time to appreciate baseball properly, but I've heard similar claims many times. I decided to do just a little investigation using statistics from the 1967 season. Of course, I am fully aware that statistics tell only part of the story; a player may certainly have an inspirational effect on his teammates (and the fans) which can't be captured in the numbers. With the caveat, let's see how Yaz did relative to his teammates over the course of the season.
I found statistics in two places:
First, let's look at the entire season at once. Below are selected hitting statistics for all players on the 1967 Boston Red Sox with more than 200 Plate Appearances:
            name  pos     PA   OBP    SLG      OPS    OPS*PA
--------------------------------------------------------------
     Yastrzemski   OF    680  .418   .622    1.040      707
           Scott   1B    641  .373   .465    0.838      537
           Smith   OF    628  .315   .389    0.704      442
         Andrews   2B    578  .346   .352    0.698      403
      Petrocelli   SS    556  .330   .420    0.750      417
             Foy   3B    499  .325   .426    0.751      375
      Conigliaro   OF    443  .341   .519    0.860      381
           Adair   3B    389  .321   .367    0.688      268
      Tartabull*   OF    368  .287   .243    0.530      195
            Ryan    C    345  .282   .261    0.543      187
--------------------------------------------------------------
The final column is my own very crude attempt to measure the cumulative contribution of a player to his team's offense, in a very quick and very dirty way. It simply multiplies the number of plate appearances by the player's OPS. No, this isn't as good a measure as more sophisticated metrics (such as BRC or EQA), but it was easy for me to compute with the numbers I had at hand.
Yaz stands out: he has more PA than any other player, the highest SLG and OBP, and an OPS more than 0.140 higher than that of any teammate.
But the stories suggest that Yaz was even better during the final six weeks of the season. Do the numbers agree?
One very important factor that doesn't show up in statistical summaries of the season is the devastating injury suffered by the Sox' second-best player, Tony Conigliaro. On August 18, 1967, during the fourth inning of a game against the California Angels, he was struck in the face by a pitch thrown by Jack Hamilton. The damage -- a broken cheekbone and damaged retina -- knocked him out of the remainder of the season, and, to a large extent, ended his promising career.
Jose Tartabull replaced Conigliaro on that game, and for much of the rest of the season. Note the difference in his offensive production: his OPS for the season was 530, 330 points lower than Conigliaro's! If the Sox were to survive, the other players would have to take up the slack.
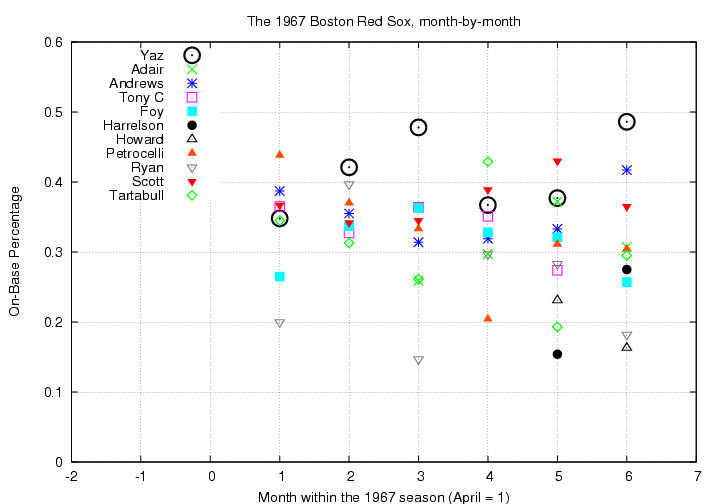
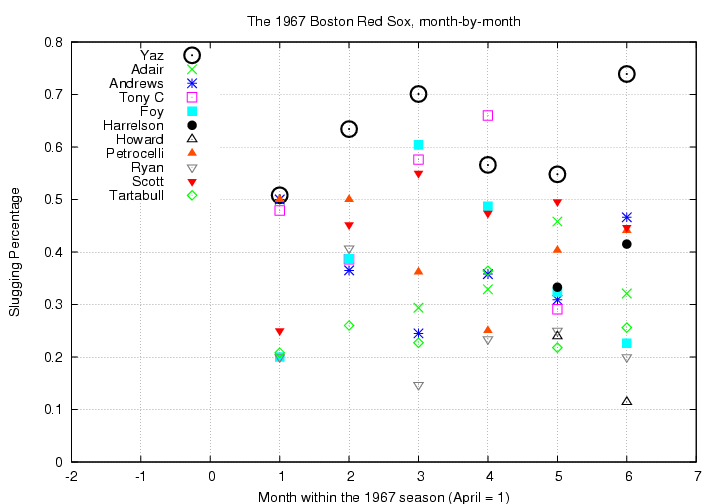
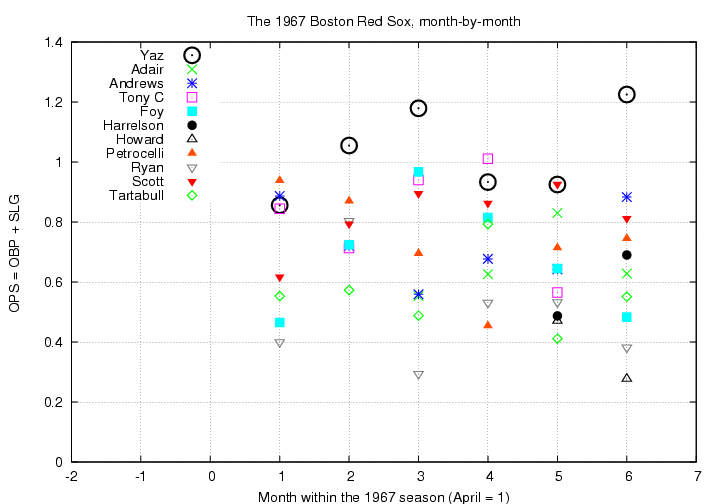
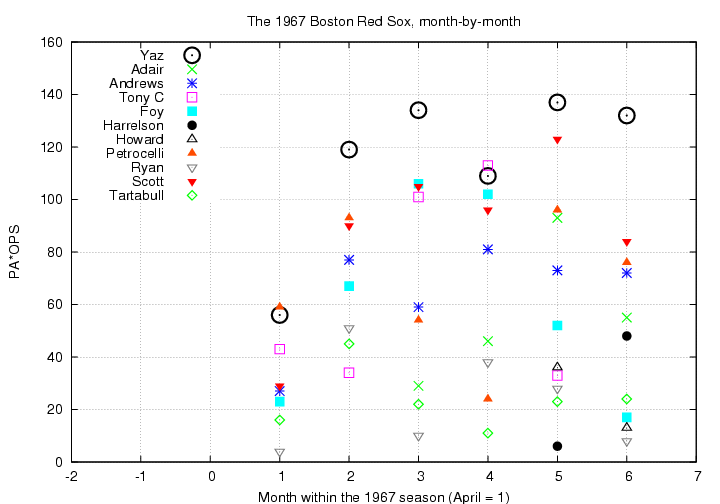
I've made up a series of graphs showing the offensive performance of the main players on the team over the course of the 1967 season. The order of the players and the symbols assigned to them are the same in all the graphs. Yaz is always the first listed, and shown by the large black open circle.
First, let's look at On-Base Percentage. Yaz certainly did improve his OBP during the last month of the season: his OBP in September (month 6) was more than 100 points higher than in August (month 5).

Next, Slugging Percentage. Again, Yastrzemski's numbers jump up very significantly during September.

Let's add together OBP and SLG to make OPS. The story is the same...

Finally, we can combine a "rate" statistic, OPS, with a "counting" statistics, the number of Plate Appearances, to come up with a very very rough idea of each player's contribution to his team's scoring during each month.

Note on this last graph the difference between Yaz and his most productive teammate: his number stays roughly the same, while Scott's goes down. George Scott had a terrific August, but his OBP dropped from 0.430 to 0.365 in September. Note also the dramatic change in the stats of third baseman Joe Foy: he was outstanding during the months of June and July, tied with Tony C. for second on the team in offensive production. In the final two months of the season, however, his numbers drop like a rock. Was he also injured in some way?
The numbers speak clearly: Yaz really did carry the team at the end of the 1967 season.
One (poor) way to quantify the statement is to compare his production, as measured by my bogus combination of PA*OPS (which I'll call "bogus units", or "BU" for short), to that of his teammates. During the month of September, the eleven players with the greatest numbers of plate appearances created a total of 590 BU. By himself, Yaz accounted for 22 percent of the total. Putting it another way, Yaz created 132 BU and all his teammates put together 458 BU. A team of 3 Yastrzemskis would have been nearly as productive as the entire Red Sox.