Everyone will accept that some baseball players are, on average, better hitters than others. Who would argue that Albert Pujols is likely to have a higher slugging percentage in 2008 than Julio Lugo? On the other hand, the notion that some players are consistently better hitters in high-pressure situations, aka "clutch hitters", is controversial. You can find many discussions of this topic wherever fans gather. For example, a quick search on the phrase "clutch hitter" reveals the following articles:
I thought I'd add a little piece of evidence to the overall picture, one that might come in handy during future discussions. I'll pick one metric of "clutch hitting" that is well defined and available for a large set of players over a period of six years, and ask the question
Are the best clutch hitters one year the same as the best clutch hitters the next year?
In other words, I'm using repetition as the main basis for the existence of this ability. If there are some players who really do exceed their own ordinary performance during certain crucial situations, year after year after year, then I'm willing to call them "clutch hitters." If they come through in the big situations one year, but fail miserably the next, then I'll simply call them "lucky" one year and "unlucky" the next.
How can we measure "performance in clutch situations?" Well, there are many different ways to do it, and I make no claim for picking the best one, but I'll use a method which involves the Win Probability Added (WPA) statistic. You can find a good description of WPA in an article by Dave Studeman. In very rough terms, WPA looks at the difference in two numbers: the probability that a batter's team will win the game as he strides into the batter's box, and the probability that his team will win the game after he leaves the box. You can beautiful graphs showing the evolution of the "win probability" over the course of a game by going to the FanGraphs web site. The numbers I used in my analyis below were taken from FanGraphs, by the way -- thanks, guys!
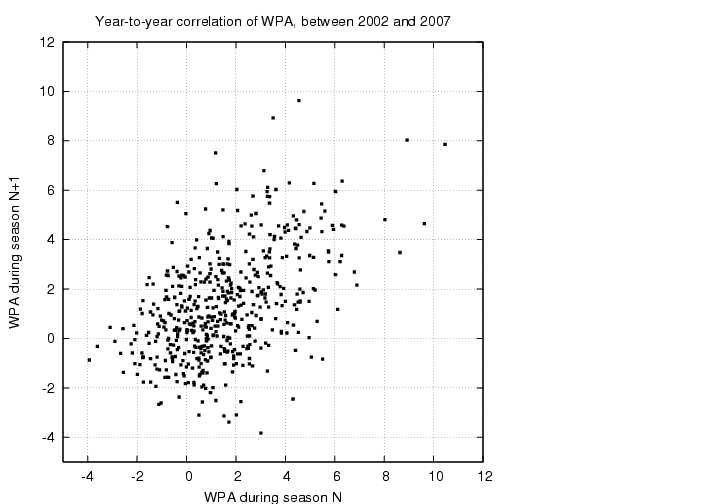
Now, before I get to the question of "clutch hitting", let me ask a simpler question: are some players better hitters than others? The answer, of course, is yes. One way to support that claim is to look at the WPA values for hitters: a good hitter increases his team's chances of winning consistently, a poor hitter does not. I plucked from the FanGraphs site the WPA values for all qualified players (I think this means "players with about 400 at-bats") between the years 2002 and 2007, inclusive. For each player, I compared the WPA value for one year -- say, 2003 -- with the WPA value for the next year -- in this case, 2004. There were 518 pairs of values in my dataset. If "good hitting" is a real skill, and if WPA measures it accurately, then the WPA value for one year ought to correlate well with the WPA value for the next year. Let's see if it does ...

Yes! The general trend here, a diagonal distribution running from lower-left to upper-right, indicates that one year's WPA does a decent job of predicting the next year's WPA. In mathematical terms, the best-fit straight line through these data is
next_year_WPA = 0.5581 + 0.5136 * (this_year_WPA)
with a correlation coefficient of R = 0.51. If a player's performance was perfectly consistent from year to year, then the distribution would lie exactly along a straight line, and the correlation coefficient would be R = 1.0.
Now, what about "clutch hitting?" Well, the way that WPA is calculated incorporates two properties of each plate appearance.
If a batter leads off the game with a home run, he advances his team's probability of winning by a small amount (about 10 percent). but if he hits a home run leading off the bottom of the ninth in a tie game, he increases his team's probability of winning by quite a bit more (about 35 percent).
I grabbed these numbers from the Win Expectancy Finder , by the way.
The relative importance of the particular situation in which a batter comes to the plate can be measured by a quantity called the Leverage Index (LI for short). You can read a nice series of articles describing LI by TangoTiger:
Again, the WPA statistic does take the importance of each plate appearance into account, so that some home runs (or singles, or groundouts) count for more than other home runs (or singles, or groundouts).
However, if one combines the WPA with the LI in a particular manner, one can remove the importance of the situation. Specifically, if one divides the WPA of each plate appearance by the LI of that plate appearance, then the contributions in crucial situations are downplayed. This combination, WPA/LI, concentrates on the quality of a hitter's performance (over which he has a great deal of control) regardless of the situation in which he finds himself (over which he has very little control).
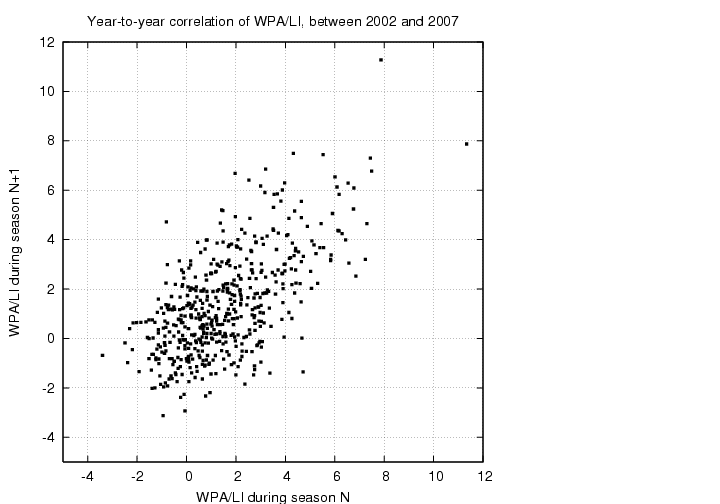
If we analyze this statistic on a player-by-player basis over pairs of consecutive years we see that it, too, has a strong positive correlation:

In fact, this correlation is even stronger than that of plain old WPA. The best-fit straight line has equation
next_year_WPA/LI = 0.4058 + 0.6270 * (this_year_WPA/LI)
with a correlation coefficient of R = 0.62. Remember that regular old WPA has R = 0.51. So, removing "leverage" from the calculations yields a more consistent measure of player performance. Hmmmm....
Okay, we finally have the tools needed to address the question of "clutch hitting". Let's define "clutchiness" in the following way, following the example of FanGraphs and this long discussion.
Clutch = WPA - WPA/LI
What does this mean? It means we are comparing "leveraged performance" (that's the WPA part) to "situation-neutral performance" (that's the WPA/LI part). If a player does better in high-pressure situations than in low-pressure situations, then his WPA score will be higher than his WPA/LI score, and thus he will have a large positive "clutch" value.
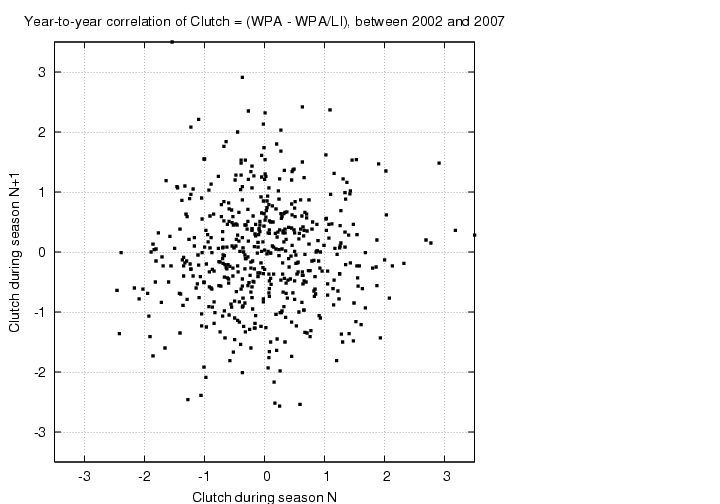
So, how well does one player's "clutch" metric from one year correlate with his "clutch" performance the next year?

Yuck! That looks like a plot of randomly scattered points, an impression which is strengthened when we try to fit a straight line to it:
next_year_clutch = -0.0297 + 0.0533 * (this_year_clutch)
with a correlation coefficient of R = 0.06. That correlation is very, very small.
I conclude that, using the (WPA - WPA/LI) metric, a batter's "clutchiness" during one year has no relationship to his "clutchiness" the next year. One could roll a die to pick the "best clutch hitter" in 2008 and do just as well as someone who watched every game of the 2007 season.