
 Copyright © Michael Richmond.
This work is licensed under a Creative Commons License.
This document is intended to give a brief, simplified view of the forces which act on a baseball as it makes its way from the pitcher's hand to home plate. I'm aiming for an audience of high-school students, so if you are looking for the really technical stuff -- like airflow over stitching and the motion of knuckleballs -- you'll be disappointed. But if you just want to get a feeling for the relative sizes of gravity, drag and the Magnus force, read on!
Let's make a few simplifying assumptions at the start.
In a real baseball game, some or all of these assumptions will be violated; but they will allow us to get a pretty good quantitative understanding of the gross properties of a curveball, for example.
I'm going to use a fixed setup for the release point of the pitch:

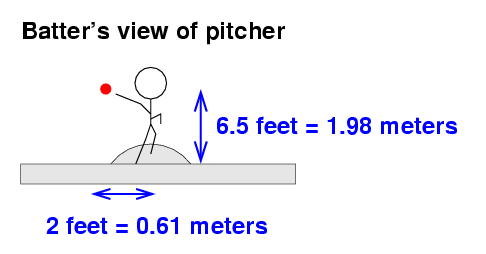
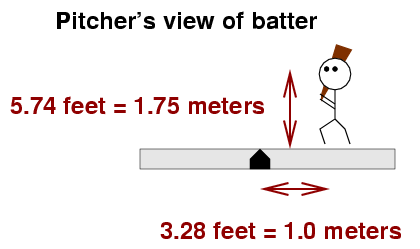
The figure above shows the release point for a right-handed pitcher. Left-handed pitchers will release the ball exactly 2 feet to the first-base side of the mound. I chose this location for the release point after looking at the measurements for several pitchers on the PITCH f/x system.
I'll adopt a coordinate system which may seem a bit peculiar. It's oriented like so:
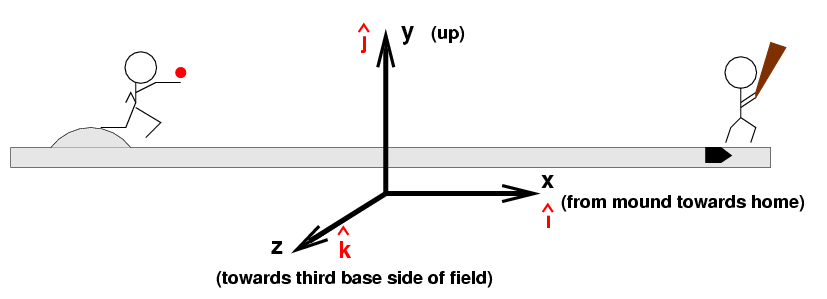
Why choose the +z axis to run towards third base instead of first? Well, this way, the coordinate system is what physicists called "right-handed", and that means that we can use very common mathematical conventions when we compute the direction of the Magnus force.
I'll also adopt the following values for the properties of a baseball and air.
Baseball
   Mass    m   =   0.145  kg

   Radius  R   =   3.683  cm  =  1.45   inch

Air
   Density ρ   =   1.23   kg / m3
To begin, let's remove all the air from a baseball stadium (and hope that the players have pressure suits). In a vacuum, there will be only one force acting on the baseball after it leaves the pitcher's hand: gravity.
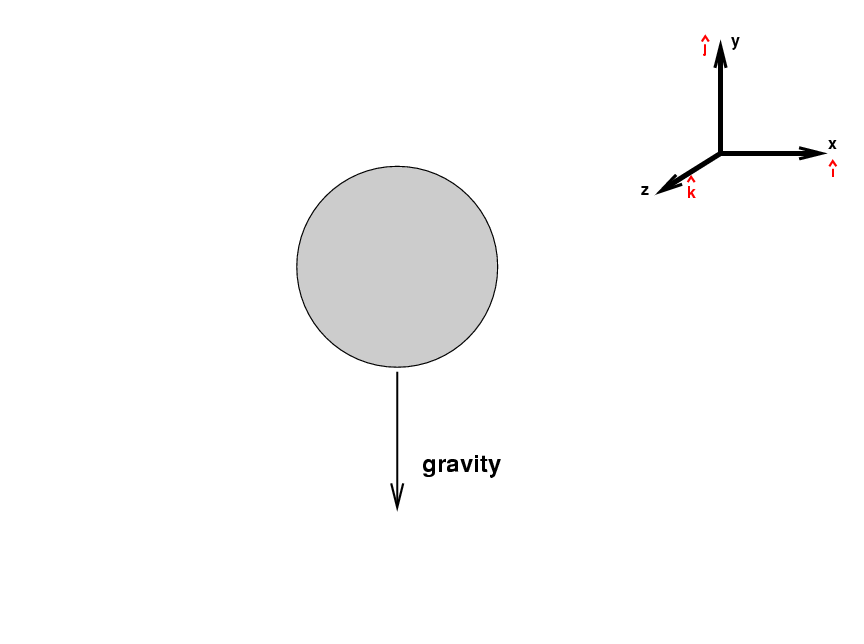
We can express the gravitional force on the ball as
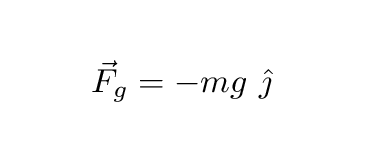
where m is the mass of the baseball, g is the gravitational acceleration at the Earth's surface (9.8 meters per second per second), and the j-hat symbol means "in the direction of the y-axis". Since gravity pulls objects down, this force is always in the negative y-direction.
  Q:  What is the size and direction
      of the gravitational force on a baseball?
When there's only a single force acting on the ball, and that force is constant in size and direction, the motion is particularly simple. The ball will follow a parabolic trajectory. It's not too hard to derive two simple equations which will yield the position of the ball as a function of time. If the ball has some initial position x0, y0 and initial velocity V0 oriented at an angle θ above the horizontal, then its position at any time t is given by

Let's consider a relatively standard pitch: a fastball thrown at 90 miles per hour (mph); to be precise, thrown so that it is travelling at 90 mph as it leaves the pitcher's hand. The center of the strike zone should be over the middle of the plate and about 33 inches or 2.77 feet above the ground (it depends on the height of the batter, of course). Here's the trajectory of a fastball which ends up in the center of the strike zone, as seen from the third-base side of the field.
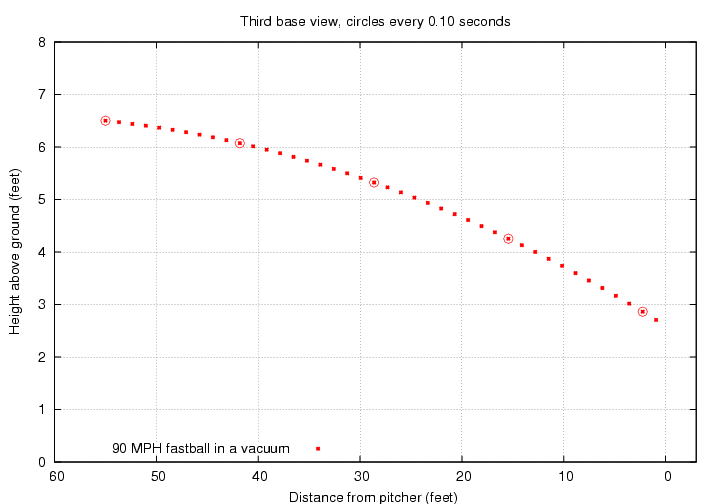
You can count the dots above to see that the ball arrives at the plate about 0.41 seconds after it leaves the pitcher's hand.
In this situation, the pitcher must give the ball an initial angle of 1.16 degrees below horizontal. When it reaches the plate, the ball will moving a bit FASTER than it was when the pitcher released it: it retains all the initial horizontal speed (89.9 mph), and it gains a bit of speed as it falls (ending at 10.8 mph downwards). So the final speed is about 90.6 mph.
Of course, in real life, balls will slow down as they move through the air. Let's see how to handle drag forces next.
As the ball moves through the air, it has to push the air out of its way. The air, in return, pushes the ball back, in the opposite direction. Therefore, the direction of the drag force will always point opposite to the instantaneous velocity.
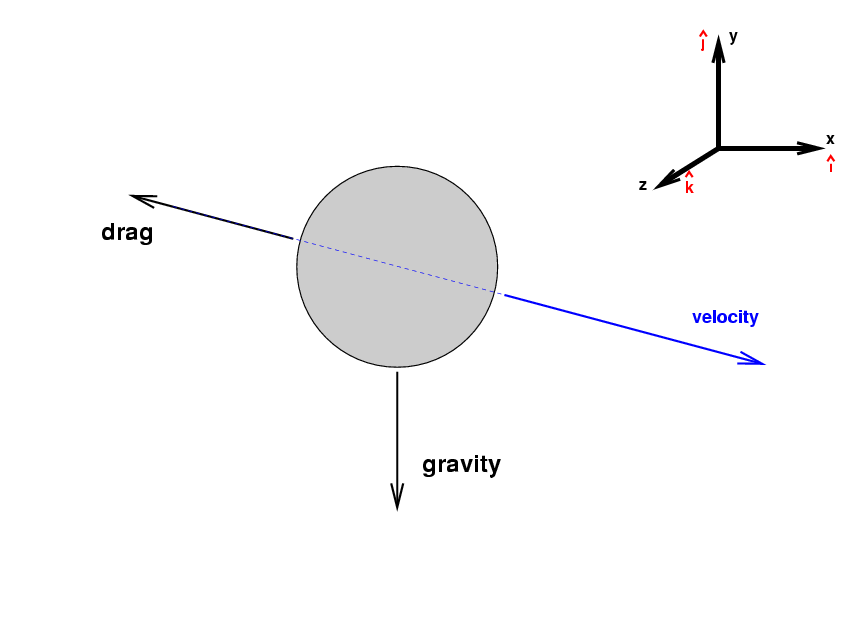
The size of the drag force is a bit complicated: it depends on the ball's speed. For the relatively narrow range of speeds of interest for pitching -- say, 60 mph to 100 mph -- the drag force is roughly dependent on the SQUARE of the ball's speed. We can write this approximation as

    CD  =   drag coefficient            =  0.40

    ρ   =   density of air              =  1.23     kg/m3

    A   =   cross section area of ball  =  0.00426  m2

    v   =   velocity of ball  (m/s)
and the expression
 is a mathematical way of
writing
"in the direction of the velocity".
I'm adopting the value CD = 0.40 based on results presented in Determining the Drag Coefficient from PITCHf/x Data by Alan Nathan and Ike Hall.
  Q:  What is the size and direction
      of the drag force on a baseball
      which is travelling horizontally
      towards home plate at 90 mph?


  Q:  Which is larger in size, the drag
      force or the gravitational force?
Since both the magnitude and the direction of the drag force change as the ball moves towards home plate, computing its effect on the trajectory takes a lot more work than accounting for the effect of gravity. There is no simple set of equations which yield the position as a function of time, alas. However, one can still integrate the motion of the ball numerically. Let's do that, and compare the motion of a 90 mph fastball in a vacuum to the same pitch travelling through air. I'll give each ball exactly the same speed and direction as it leaves the pitcher's hand.
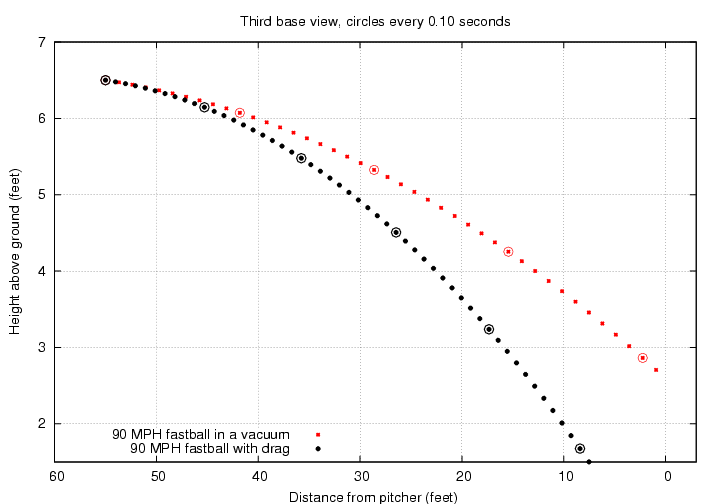
There are two main differences due to the drag force:
By the time it reaches the plate, the fastball in air isn't moving 90 mph any more. Its horizontal speed is about 80 mph, so a 90 mph fastball loses about 10 mph due to air resistance by the time it reaches the batter. This loss of speed is larger for pitches which start out faster -- after all, the drag force does grow with the square of the speed.
initial horizontal speed     final horizontal speed      loss
----------------------------------------------------------------------
  100 mph                          88 mph                12 mph
   90 mph                          80 mph                10 mph
   80 mph                          71 mph                 9 mph
   67 mph                          59 mph                 8 mph
----------------------------------------------------------------------
Clearly, the drag force has a big effect on a baseball; losing about 10 percent of the initial speed is a big deal. On the other hand, the effect of the drag force is always the same: to delay the ball's arrival at the plate and cause it to drop a bit. There's nothing a pitcher can do to alter this behavior, which means that he can't do much to fool a good hitter. If only there were some way for the pitcher to alter the ball's motion in an unpredictable way ....
A spinning object moving through the air will experience an additional force, due to the the interaction of its surface and the air: one portion of it will be rotating WITH the air, while another portion will be rotating AGAINST the air. There are several ways to characterize this interaction, and the resulting force. For our purposes, I'll refer to it as the Magnus force, and adopt a relatively simple equation to quantify its effect:

where
    CL  =   lift coefficient            (see below)

    ρ   =   density of air              =  1.23     kg/m3

    A   =   cross section area of ball  =  0.00426  m2

    v   =   velocity of ball  (m/s)
Let's wait for a moment to discuss the
lift coefficient CL,
and ask instead, "In which direction does the
Magnus force push the baseball?"
The last section of the equation above provides the
answer, if you know how to read vector notation:
![]() means that
the direction of the Magnus force is
perpendicular to both
the ball's axis of rotation
means that
the direction of the Magnus force is
perpendicular to both
the ball's axis of rotation
![]() and the ball's velocity
and the ball's velocity
![]() .
.
It will be easier to understand with a picture, which like all the others so far is taken from the third-base dugout, looking towards the pitcher's mound. I'll give the ball pure backspin, so that the rotation axis is horizontal.
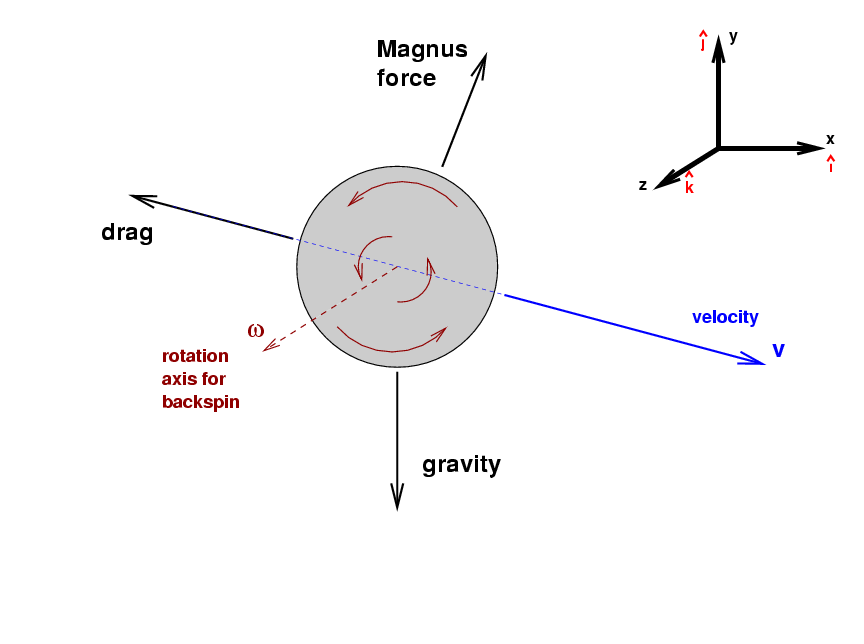
With pure backspin, the rotation axis must be horizontal ... but
should the direction of
![]() point towards first base, or towards third base?
The rule is that, if you hold your right hand on the axis
and wrap your fingers around it in the direction of rotation,
your outstretched thumb points in the direction of the
vector describing the rotation.
In this case, if we wrap the fingers of a right hand
around the ball in the figure above to match the ball's rotation,
that right hand's thumb will point towards third base.
point towards first base, or towards third base?
The rule is that, if you hold your right hand on the axis
and wrap your fingers around it in the direction of rotation,
your outstretched thumb points in the direction of the
vector describing the rotation.
In this case, if we wrap the fingers of a right hand
around the ball in the figure above to match the ball's rotation,
that right hand's thumb will point towards third base.
Phew.
Once we have the directions of
![]() and
and
![]() ,
we can use the standard mathematical cross product
to determine the direction of the Magnus force.
,
we can use the standard mathematical cross product
to determine the direction of the Magnus force.
Perhaps you'd like to read a brief review of the vector cross product?The rule again involves one's right hand: point your outstretched fingers so that they point along the direction of the first vector,
Let me repeat that: when a pitcher throws a ball with pure backspin, the ball is pushed upwards as it moves through the air. How large is this Magnus force? In order to calculate its size, we need to know the value of the lift coefficient CL. Unfortunately, unlike the drag coefficient, the lift coefficient varies quite a bit in ordinary baseball circumstances. In particular, it depends on the ratio of the rotational speed Vr to the translational speed Vt.
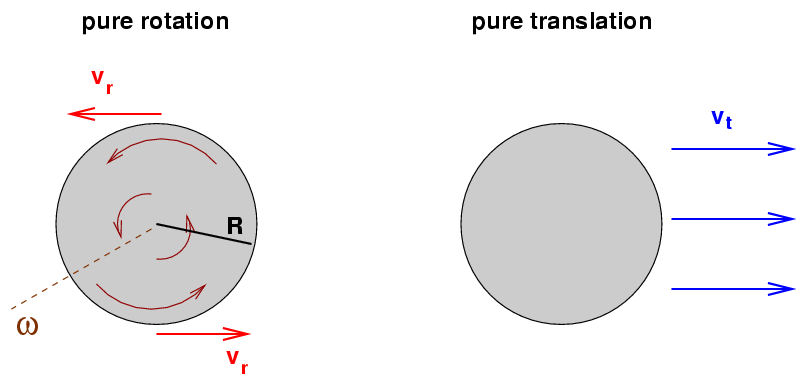
Physicists use the symbol S, for "spin factor", to describe the ratio of the rotational motion of a ball to its translational motion.
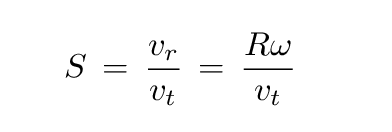
Recall that the radius of a baseball is R = 1.45 inch = 3.683 cm. What is the rotational speed ω for a baseball? Well, I used an article with PITCH f/x measurements for Greg Maddux to pick some representative values.
 Pitch type     spin direction   ω (RPM)      ω (rad/s)        vr
----------------------------------------------------------------------------
  fastball        backspin        2200

  changeup        backspin        1300

  curve           topspin         1300
----------------------------------------------------------------------------
   Q:  Can you fill in the final two columns
       of the table above?
Now, finding the rotational speed is only the half the battle. We also need the translational speed of each pitch. I've chosen some round numbers which are easy to remember in the table below.
                                   vr          vt
 Pitch type     spin direction    (mph)       (mph)          S
----------------------------------------------------------------------------
  fastball        backspin                     90

  changeup        backspin                     80

  curve           topspin                      80
----------------------------------------------------------------------------
   Q:  Can you fill in the missing two
       columns of the table above?
If we know the spin parameter S for a particular pitch, then we can figure out the lift coefficient CL. Alan Nathan's article The Effect of Spin on the Flight of a Baseball presents the results of a set of measurements of baseballs thrown by a pitching machine past the view of high-speed cameras. Below is Figure 5 from his article:
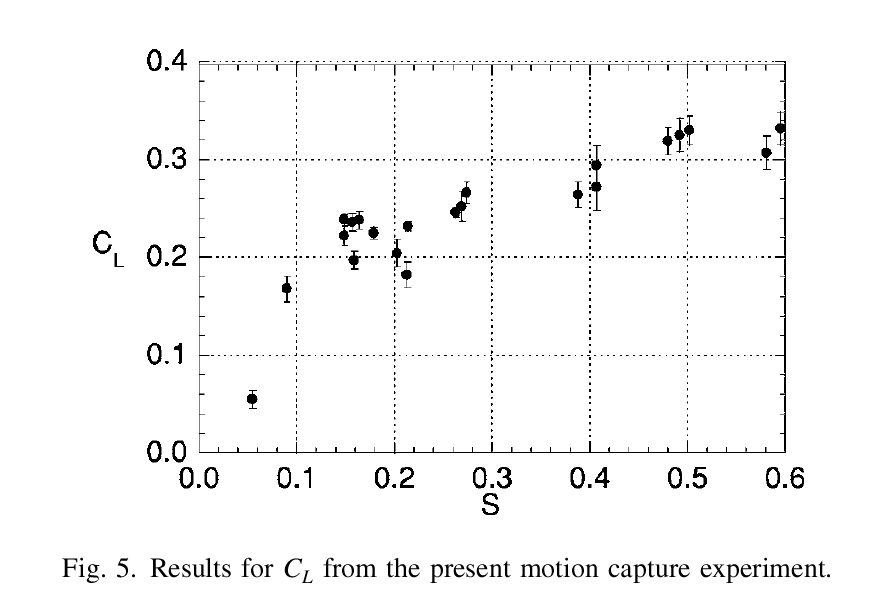
Image courtesy of
Alan Nathan
and
the American Journal of Physics
As you can see, the lift coefficient CL increases as the spin parameter S increases --- but not in lockstep. In my computations, I fit this relationship with three linear segments; but for rough purposes, one might make the simple assumption that, over the range of spin values of ordinary pitches (0.10 < S < 0.25), the lift coefficient is approximately constant at CL = 0.22.
That was a lot of work, but we are now ready to figure out exactly what the Magnus force will do to some real baseballs.
Now that we know how to deal with the Magnus force, we can apply it to real situations. Let's consider three pitches -- and rather simplified types of each.
Remember this equation for the Magnus force on a spinning ball?

where
    CL  =   lift coefficient            =  0.22     (approximately)

    ρ   =   density of air              =  1.23     kg/m3

    A   =   cross section area of ball  =  0.00426  m2

    v   =   velocity of ball  (m/s)
We can now compute the size and direction of the Magnus force for each pitch. Let's start with the fastball.
                                   v_t      v_t         Magnus force
 Pitch type     spin direction    (mph)    (m/s)    size (N)     direction
----------------------------------------------------------------------------
  fastball        backspin        90.0     40.2       0.93       mostly up
----------------------------------------------------------------------------
Look at that! The size of the Magnus force is similar to the size of the other two forces on the ball:
We can't ignore any of these forces; in order to determine the trajectory of a pitch accurately, one MUST include all three.
So, I wrote some code to integrate the effect of all three forces numerically as the ball travels from the pitcher's hand to home plate. Let's start by comparing the motion of a "dead" fastball -- one which doesn't spin at all, and so feels no Magnus force, only gravity and the drag force -- to a "live" fastball -- one with a realistic amount of backspin. Both balls start with the same speed, 90 mph. Both balls are given the same initial direction, too, which is chosen so that the "dead" fastball ends up exactly in the middle of the strike zone.
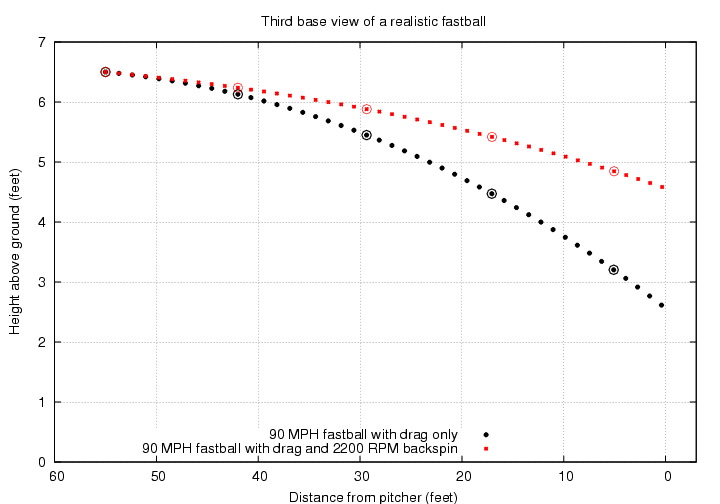
Holy mackerel! The backspin on a real fastball has a MAJOR effect on its trajectory. The spinning ball ends up about 2 feet higher than the "dead" ball when it crosses home plate.
The lift given by the Magnus force to a ball with backspin is responsible for the phrase "a rising fastball." However, the fastball doesn't REALLY rise; it just falls less than it would if it weren't spinning. In order to make a pitch really rise, one would have to be superhuman: below is the trajectory of a pitch with
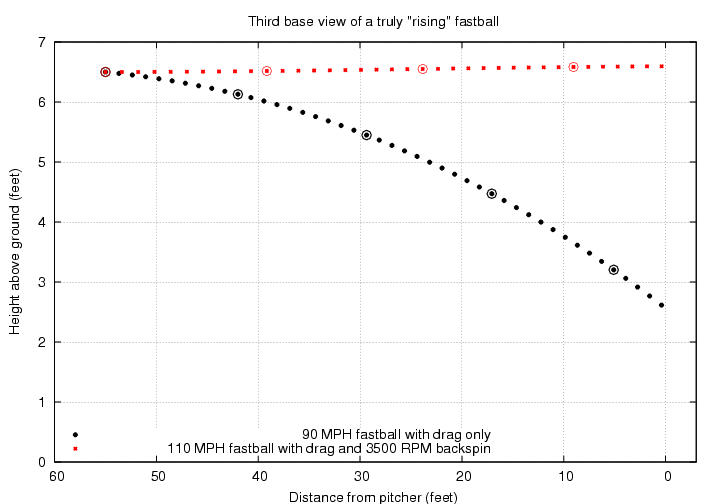
Of course, if one were throwing a ball with the same size as a baseball but less mass, then
In that case, one might be able to throw a ball so that it rises quite a bit on its way to the plate. You can click on the picture below to see some examples from a Wiffle Ball tournament; I suggest starting at 2:14 from the beginning of the clip.
Yes, yes, a whiffle ball has holes on just one side, which causes all sorts of extra aerodynamic effects.
Let's turn to a second pitch: the changeup. This is very similar to the fastball, with just two differences:
                                   v_t      v_t         Magnus force
 Pitch type     spin direction    (mph)    (m/s)    size (N)     direction
----------------------------------------------------------------------------
  changeup        backspin        80.0     35.8       0.74       mostly up
----------------------------------------------------------------------------
The result is a pitch which has considerably less lift than a fastball, so it falls more before it reaches the plate. It also takes a bit more time to reach the plate, too. For example, suppose that a pitcher throws an ordinary fastball right through the middle of the strike zone on the first pitch, then switches to the changeup with exactly the same release point and initial direction.
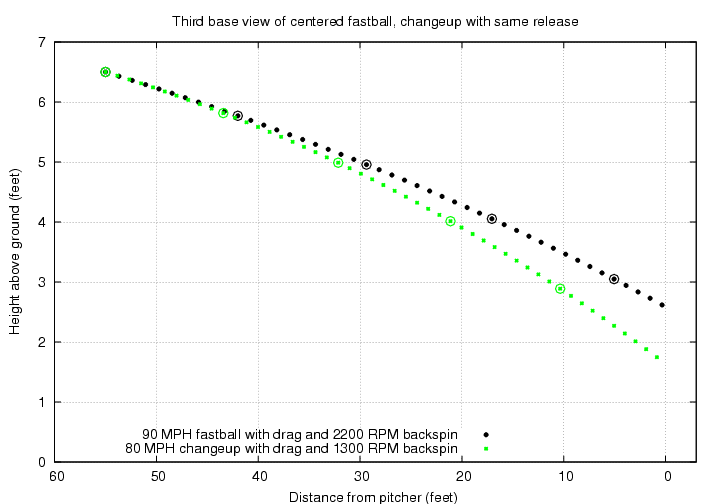
Note how similar the two pitches appear when first released. The second pitch takes an extra 0.06 seconds to cross home plate, which can cause a batter to swing too early. It also ends up about 12 inches below the center of the strike zone.
  Q:  How does this extra drop of 12 inches
      compare to the diameter of a baseball?
Finally, let's consider a particular type of curveball: one thrown with pure topspin. Most real curveballs have a considerable amount of sidespin as well, but let's leave that complication for later. Our simple curve will
                                   v_t      v_t         Magnus force
 Pitch type     spin direction    (mph)    (m/s)    size (N)     direction
----------------------------------------------------------------------------
  curve           topspin         80.0     35.8       0.74       mostly down
----------------------------------------------------------------------------
Topspin means that the axis of rotation points towards the first-base side of the field.
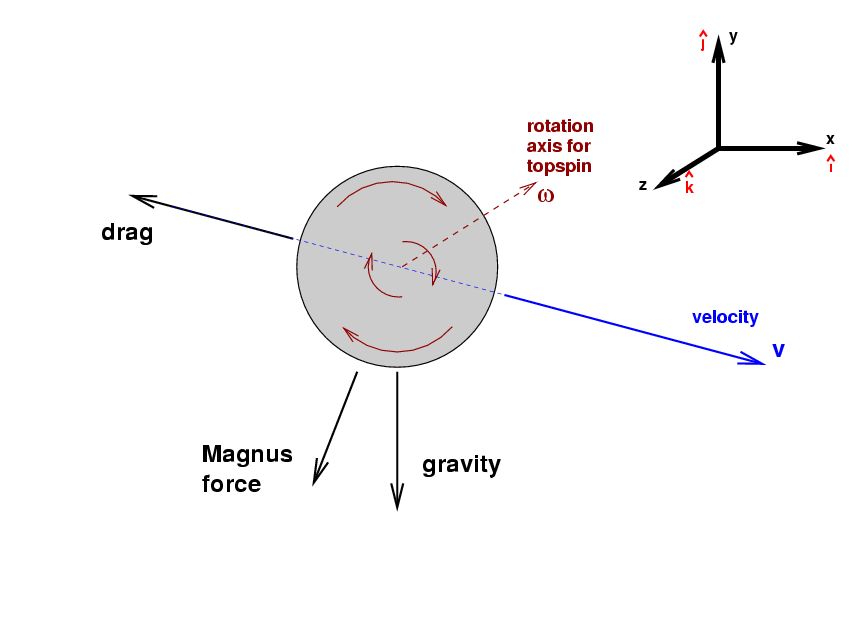
If we perform the cross product of
![]() and
and
![]() now,
we'll find that the result points mostly downwards.
With two forces pushing them downwards,
curveballs drop very rapidly.
In fact, if one throws a curveball with
exactly the same initial direction as a fastball,
it won't even reach the plate!
now,
we'll find that the result points mostly downwards.
With two forces pushing them downwards,
curveballs drop very rapidly.
In fact, if one throws a curveball with
exactly the same initial direction as a fastball,
it won't even reach the plate!
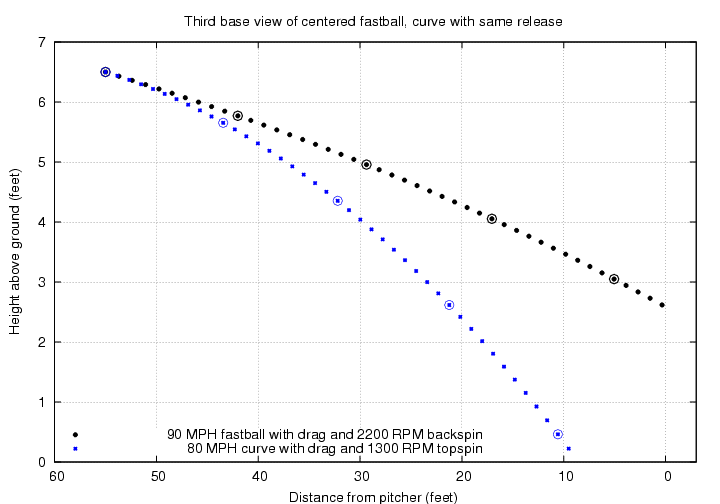
If you want a curveball to end up in the middle of the strike zone, you need to give it an initial velocity which is slightly ABOVE the horizontal:

If you look at the last figure just above, you'll see that the trajectory of a curveball which ends up in the middle of the strike zone is very different from that of a fastball which ends up in the middle of the strike zone. The curveball flies upwards briefly, then gradually descends. When it is halfway from pitcher to batter, the curveball is about 14 inches higher than the fastball. A hitter would notice that easily. He might not be able to hit the ball, of course, but he might at least be able to alter the timing of his swing.
Suppose that a pitcher wants to keep the batter guessing, even after the ball has left his hand. Is there a way to "disguise" a curveball, so that it doesn't stand out from the other pitches? Sure -- all the pitcher has to do is alter the initial direction of the pitch a bit.
Robert Adair, in his book The Physics of Baseball, estimates that hitters must start reacting to a pitch about 0.23 seconds before it reaches the plate; in other words, they need to make the decision "swing or don't swing" when the ball is roughly halfway to the plate. Let's see what this implies for the recognition of pitches.
I'll make a slight modification to Adair's value and assume that the batter starts to react exactly 0.23 seconds after the ball is released; that gives another 0.22 seconds for the ball to reach the plate, if it's a fastball, so it's saying pretty much the same thing. With a little extra practice time and a high-speed video camera, a pitcher could figure out how to throw the three basic pitches so that each one is at exactly the same height at this critical time. I'll mark that height -- 4.7 feet -- with a black line in the diagram below.
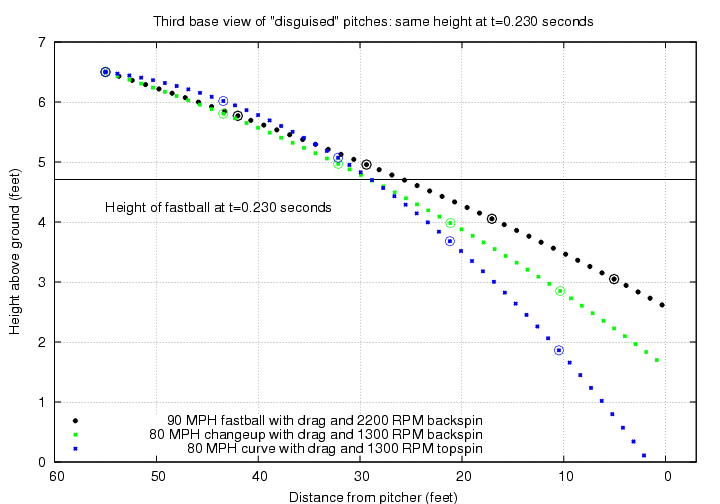
The fastball ends up in the middle of the strike zone, reaching home plate 0.22 seconds after the batter starts to react. The changeup crosses the plate 0.27 seconds after the batter reacts, about one foot lower than the fastball. The curve bounces in the dirt before it reaches the plate.
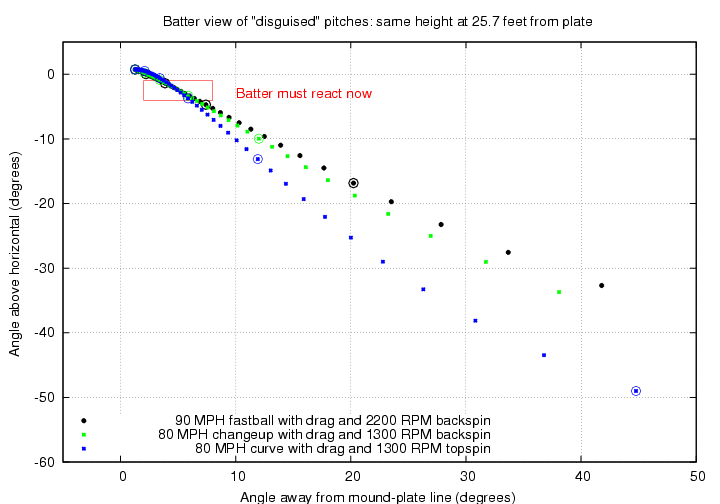
We can also look at these three pitches from the batter's point of view. In the figure below, dots mark the position of each pitch in angle: the vertical scale is "degrees above horizontal" -- so positive numbers means the batter has to look up -- and the horizontal scale is "degrees away from the mound-plate line" -- so that positive numbers means the batter is looking towards the first-base side of the mound. The release point is at upper-left in this diagram.

As you can see, when the batter has to decide "Swing, or no swing?", the difference in angular position between the three pitches is less than two degrees.
"But wait," you might object, "this isn't a perfect disguise. The batter can use his depth perception to notice that these three pitches aren't all at the same distance when they pass through that height of 4.7 feet." Yes, you are correct. But with a little more practice and video analysis, the pitcher can adjust his release so that each one of the pitches passes through exactly the same point in space: 4.7 feet above the ground and about 25.7 feet away from home plate. As the figure below shows, the curveball and change do take a little bit longer to reach this point.
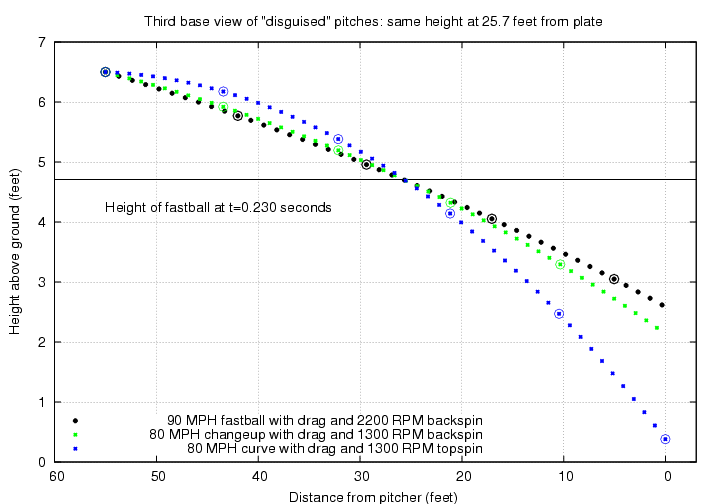
Now the changeup is about 6 inches below the fastball when it crosses the plate -- still enough to cause the bat to miss the ball completely. The curveball does manage to reach the plate in the air, though it's just a few inches off the ground.
Looking at these pitches from the batter's point of view again, the difference between them is even smaller than it was before.
All the pitches described so far have spins which are very simple to describe: pure backspin (fastball and changeup) or pure topspin (curve). While these are decent approximations, they don't resemble real pitches in one respect: they don't allow for any horizontal break.
Why not? Well, think about the forces on the ball:
But it IS possible to make a ball curve horizontally. All we need to do is to tilt the spin axis a bit. It will help if we look at a new sort of diagram, one which shows the ball from center field, looking in towards home plate, just after the ball leaves the pitcher's hand.
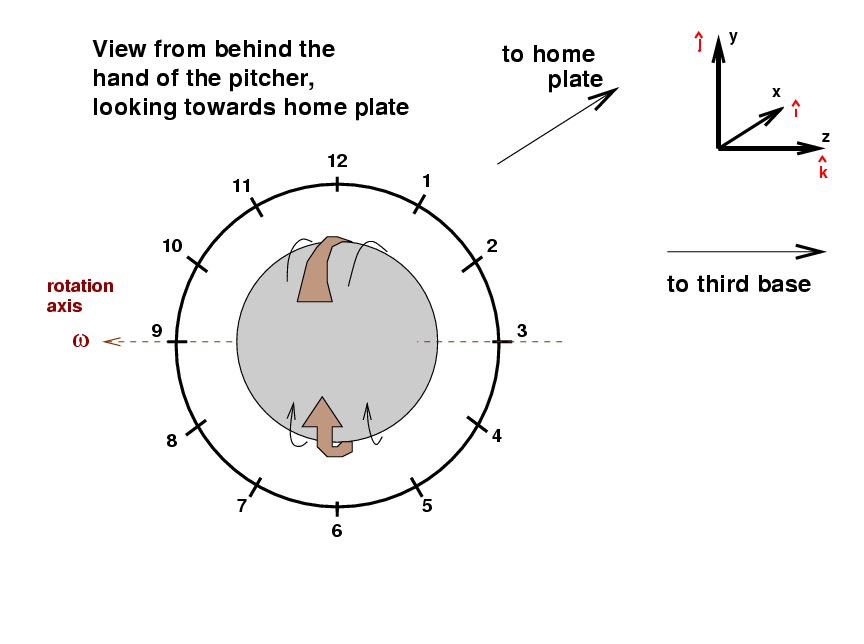
I've drawn a clock face around the ball as a guide for describing the direction of spin. This curve ball has pure topspin, so that the portion of the ball which is rotating fastest towards home plate is closest to the "12" on the clock face. We could call this a "twelve o'clock curveball" if we wanted. The Magnus force on this ball will be straight down; you might hear the broadcaster describe this as a "twelve-to-six curveball."
But if the pitcher tilts his hand by about 30 degrees as he releases it, we would see a somewhat different spin orientation:
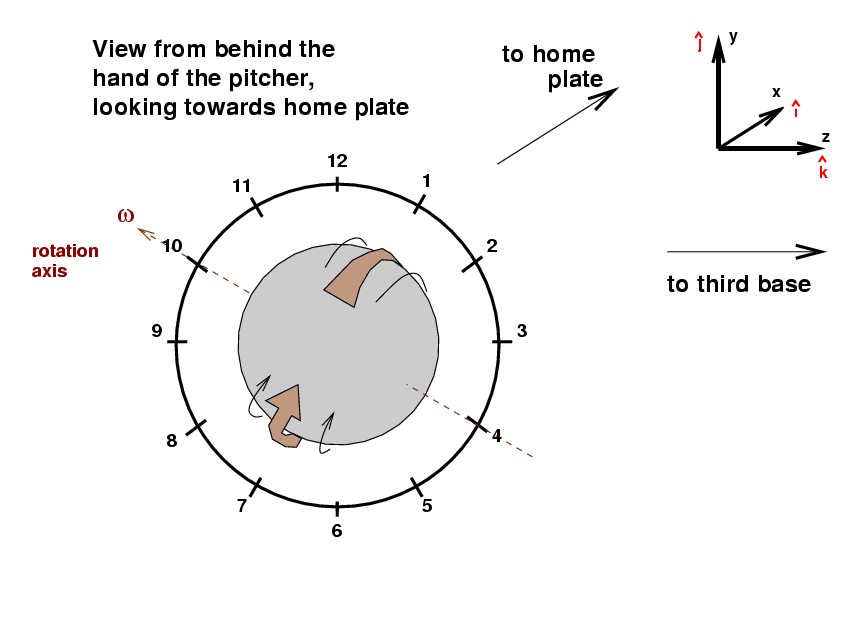
We could call this a "one o'clock curveball" because the portion of the ball which spins forward most quickly is now next to the "1 o'clock" position in the diagram.
The spin direction
![]() is no longer horizontal,
but points
is no longer horizontal,
but points
That means that the direction of the Magnus force changes, too. Using the right-hand rule, one can compute the new direction, given by
  Q:  Can you figure out which way the Magnus
      force pushes this curveball?

      Will it break towards a right-handed
      batter, or away from him?
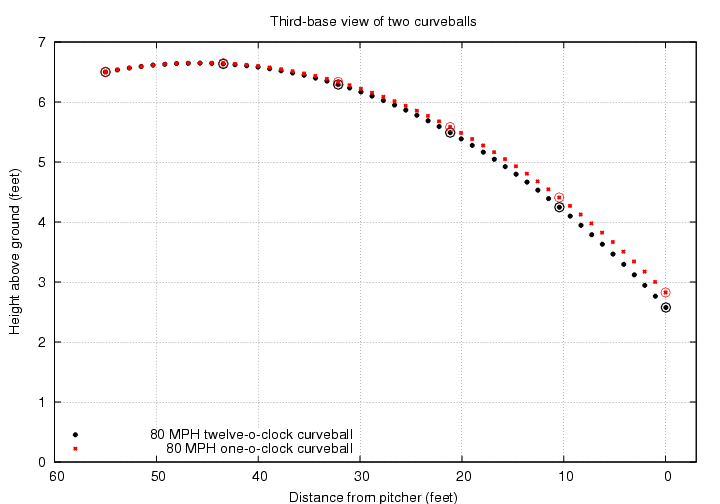
I'll compute the trajectories of two curve balls:
If we look at these two curves from the side, they don't appear greatly different. Because only a portion of the Magnus force pushes the one o'clock curve down, it doesn't fall quite as far as the twelve o'clock curve; but the difference is only about 3 inches.
However, if we look at these pitches from the catcher's point of view, we see that the horizontal component of the Magnus force does make quite a difference:
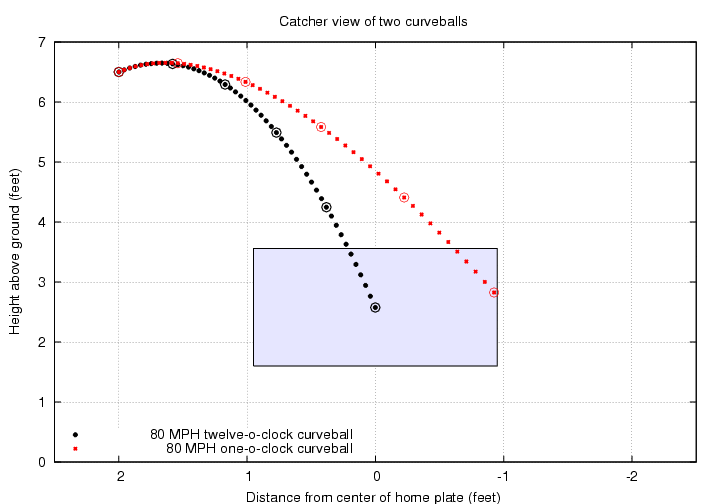
The horizontal break on the one o'clock curve pushes it out to the very edge of the strike zone, about 11 inches from the center of the plate. I've drawn a strike zone which is based on the width of home plate (8.5 inches to each side of the center), plus an additional width of one ball diameter on each side (another 2.9 inches)
From the pitcher's point of view, this ball breaks from upper-right to lower-left as it approaches the batter. The pitcher might reasonably describe this as "a one o'clock to seven o'clock curveball".
Don't forget that a typical pitcher will release the ball about two feet to the side of the mound; I've drawn the flight of a ball thrown by a right-handed pitcher in the figure above.
When managers make up their lineups for each game, they pay quite a bit of attention to the opposing pitcher. In general, if the opposing pitcher throws with his left hand, the manager will try to fill his lineup with batters who stand in the box on the third-base side of home plate (right-handed hitters); if the opposing pitcher throws with his right hand, the manager will insert batters who stand on the first-base side of home plate (left-handed batters). Why?
The answer has two parts.
Let's look at the pitching half of this story.
Recall from the previous section that if a pitcher throws a curveball by giving the ball topspin, and holds the ball so that the top of the rotation is at one o'clock

then, compared to a ball thrown with no sidespin, this ball will slide towards the first-base side of home plate:

So, just how easy is it for a pitcher to hold and release the ball so that the top of the spin is located at one o'clock? Let's look at a right-handed pitcher as he is about to release the ball, in a view taken by the center-field camera.
The pitcher's hand holds the third-base side of the ball. If his arm angle at the release were vertical, directly over his head, then when he snapped his wrist forward, he would give the ball pure topspin. Most pitchers, like the one shown above, have more of a "three-quarters" arm angle: they hold their arms both up and towards the side. In this situation, the pitcher holds the ball so that it is cupped slightly from below, as well as being held from the third-base side. At a right-handed pitcher snaps his wrist forward, he gives the ball both topspin and some sidespin: the top of the spinning motion is tilted to the third-base side.
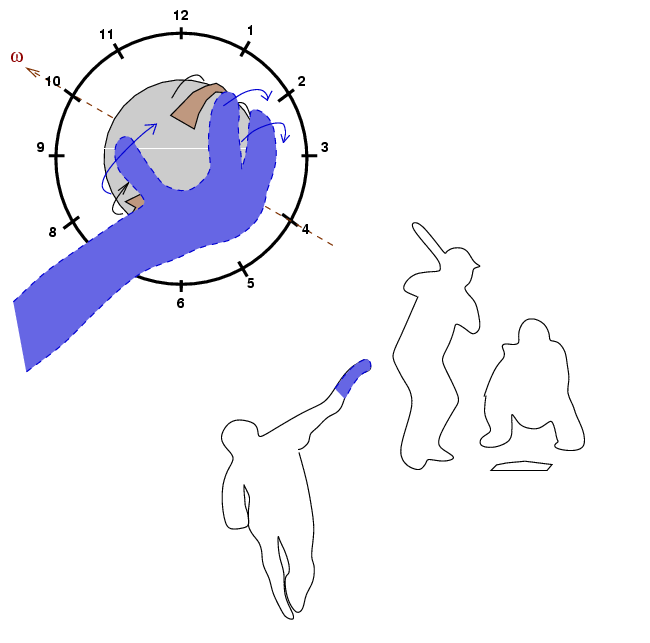
Thus, when a right-handed pitcher throws a curveball, the top of the spinning ball will be tilted towards the one o'clock side. As a result, his curveball will both
On the other hand, when a right-handed pitcher throws a fastball, his grip is different: he lets the ball roll off his fingers as he pushes it forward. That gives the ball backspin, again with a tilt in the same direction.
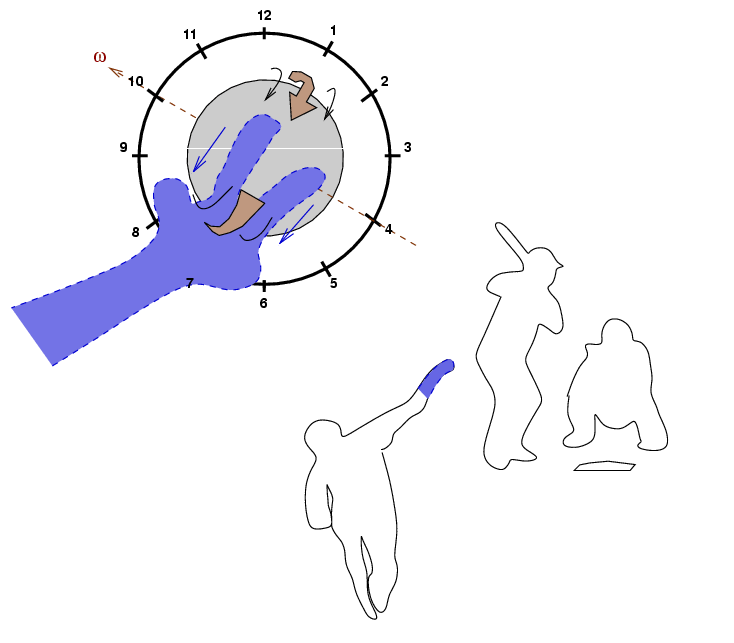 So when a right-handed pitcher throws a fastball,
the top of the back-spinning ball will be tilted
towards the one o'clock side.
As a result, his fastball will both
As an example, consider these pitches thrown by right-hander Daisuke Matsuzaka during the 2009 World Baseball Classic, in a game against Cuba. This (and following) graphics come from the wonderful Pitch FX tool on brooksbaseball.net . The graph shows the speed of each pitch on the vertical axis (fast at the top, slow at the bottom), and the amount of horizontal motion relative to a ball with no spin on the horizontal axis. The graph shows motion from the catcher's point of view, so first base is to the right and third base to the left.
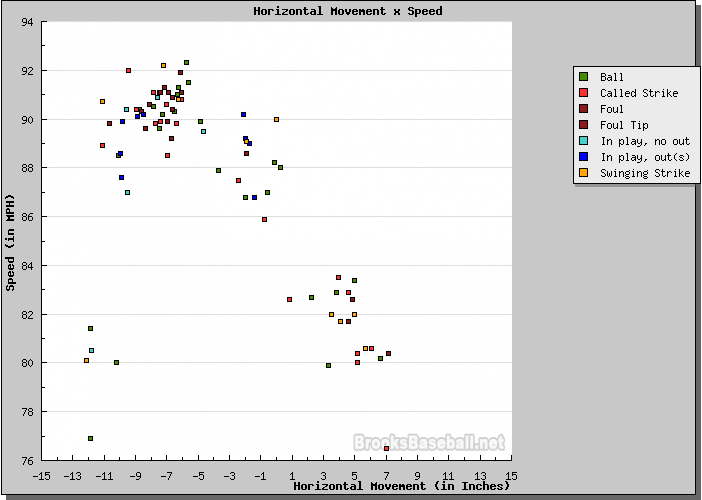
Let me add a few notes to this picture, and identify the different pitches.
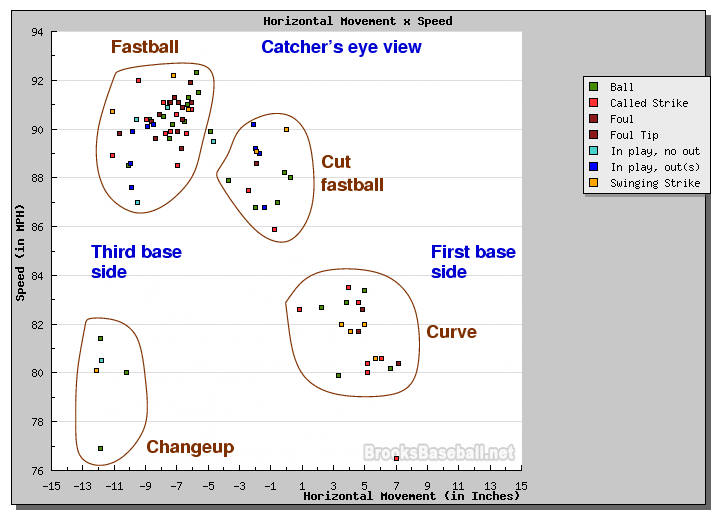
The easiest pitches to recognize are the fastball -- it's the fastest, of course! -- and the changeup, which ends up in nearly the same horizontal location as the fastball, but moves more slowly. The clump of points at lower right might be called either "curves" or "sliders", depending on how much they break and how fast they are. Curves go slower and have a larger break, while sliders move less and go faster. The group of pitches near the center, with little horizontal motion and thrown at 86-90 mph, are "cut fastballs", or "cutters."
Now, for a left-handed pitcher, everything goes in the opposite direction. The slight tilt applied to an ordinary curveball will go in the opposite direction, just because a left-handed pitcher's arm is tilted towards the first-base side of the field, rather than the third-base side of the field. A lefty's curve will break towards the third-base side of the plate.
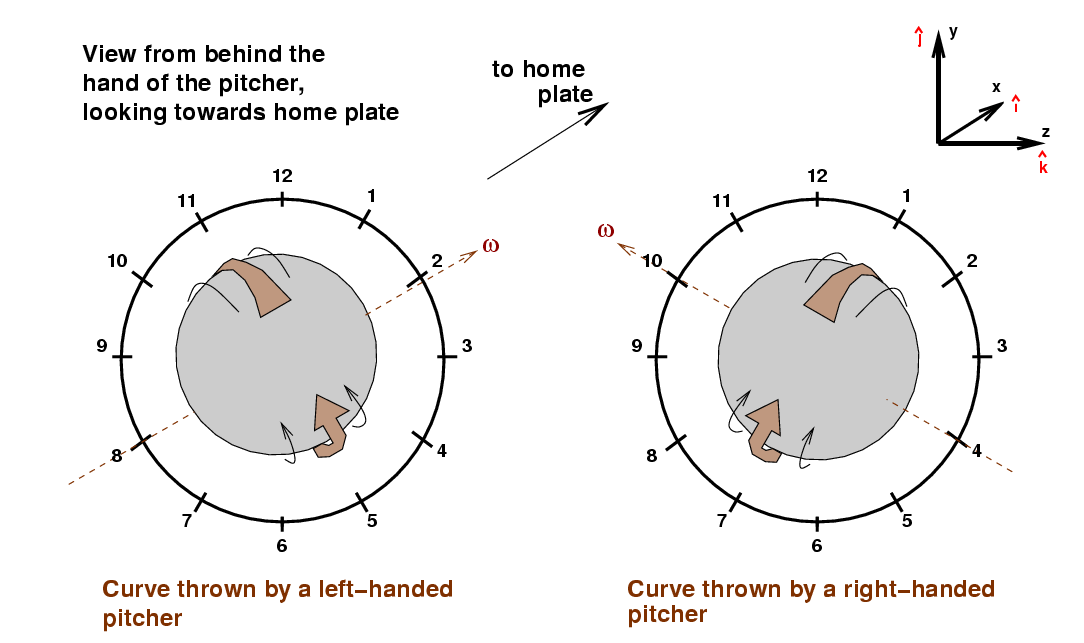
Likewise, the slight tilt applied to an ordinary fastball by a left-handed pitcher will cause it to break towards FIRST base, not third base.
As an example, consider left-handed pitcher Jon Lester's start against the Minnesota Twins on July 8, 2008.
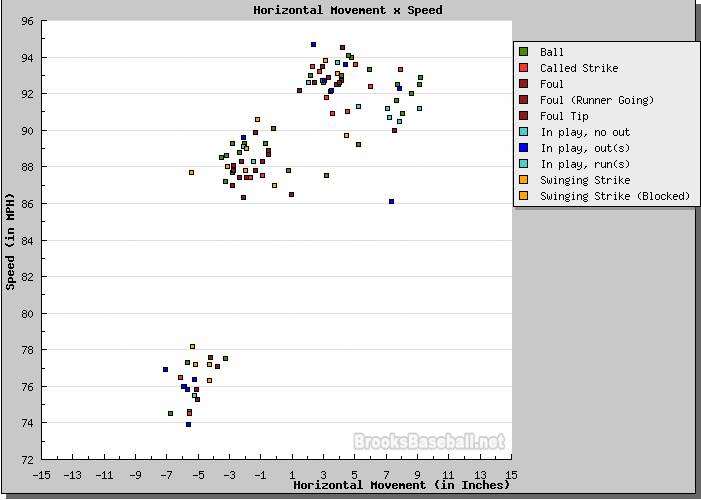
Note how this distribution is basically the mirror-image of Matsuzaka's: fastballs are in the upper-RIGHT corner (instead of upper-left), and breaking stuff is in the lower-LEFT corner (instead of lower-right). Let me add some labels again:
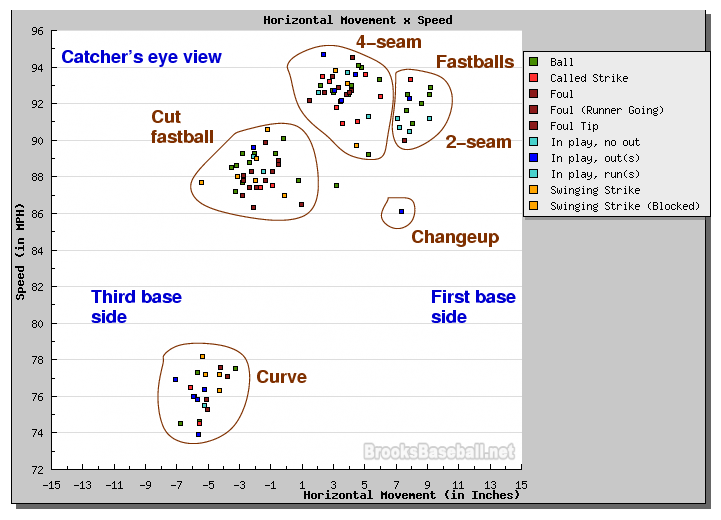
I'm calling the clump of pitches with speed 86-90 mph and a slight movement towards third base "cut fastballs", but one might also label them "sliders", I suppose.
One way to contrast the two pitchers is to put all their pitches on a single graph. I apologize for the somewhat washed-out appearance of this composite, but at least it does the job. Matsuzaka's pitches are in black, Lester's in red.
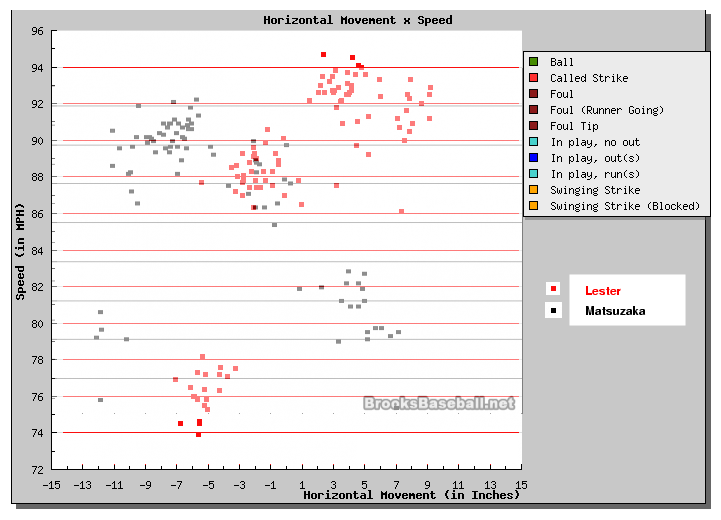
Lester's pitches have a greater range of speeds, from a 4-seam fastball at about 95 mph to a very slow curve at about 74 mph -- a 21-mph difference. Matsusaka can only manage a 16-mph difference between his best fastball and slowest changeup. On the other hand, Matsuzaka's horizontal range of motion is about 19 inches, while Lester's is only 16 inches. Perhaps one might describe Lester as a "power" pitcher, while Matsuzaka might be more of a "breaking-ball" pitcher.
Okay, to summarize,
What about hitters? Which pitches give them the most trouble? I'm not a baseball player, but from the constant attempt of defenses to match a lefty pitcher against a lefty batter, and vice versa, we can conclude that batters have more difficulty hitting curves and sliders which break AWAY from them.
If this is true, then one might expect to see some correlation between the range of horizontal motion in a pitcher's arsenal and the difference in his performance against batters on opposite sides of the plate. That is, a right-handed pitcher whose curves break very strongly in the horizontal plane might do very much BETTER against right-handed batters than he does against left-handed batters, while a right-handed pitcher with only a small horizontal break might not show such a difference.
Just for fun (since a proper test would involve many, many pitchers, not just two), let's test this theory against the two pitchers I've used in this example: Lester and Matsuzaka. Since Lester's horizontal range is smaller than Matsuzaka's, we might guess that his "split" between right-handed and left-handed batters would be smaller. I grabbed data for the 2008 season from baseball-reference.com ...
| Pitcher | Vs. right-handed batters | Vs. left-handed batters | |||||
| . | BA | OBP | SLG | BA | OBP | SLG | |
| Matsuzaka | 0.195 | 0.284 | 0.280 | 0.225 | 0.353 | 0.365 | |
| Lester | 0.273 | 0.341 | 0.395 | 0.217 | 0.269 | 0.302 | |
Well, each pitcher does have a platoon split in the predicted manner -- so that's good. But Lester's split is larger than Matsuzaka's, despite Lester's smaller horizontal range. Obviously, there's a lot more to pitching than how much spin one can put on a ball ...
 Copyright © Michael Richmond.
This work is licensed under a Creative Commons License.