 Copyright © Michael Richmond.
This work is licensed under a Creative Commons License.
The 2007 Red Sox, after a strong start, entered a period of mediocre performace sometime around June. There have been many discussions about the nature of this slump: is it unusual for a good team to spend a long time playing no better than average? In order to help these discussions, I have put together a bit of information on the historical performance of many teams.
My dataset is the American League during the period 1961 to 2006, excluding the strike-shortened years of 1972, 1981, 1994 and 1995. All the information comes ultimately from baseball-reference, a most excellent source of all things baseball.
First, a few easy things:
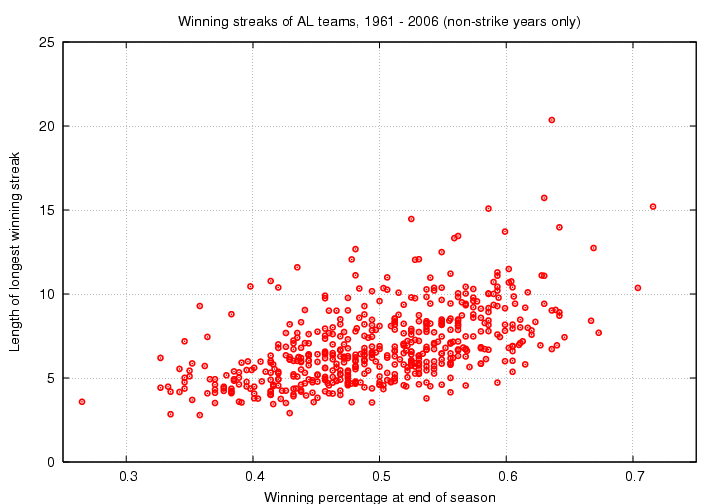
Here are graphs addressing these questions. First, for winning streaks:

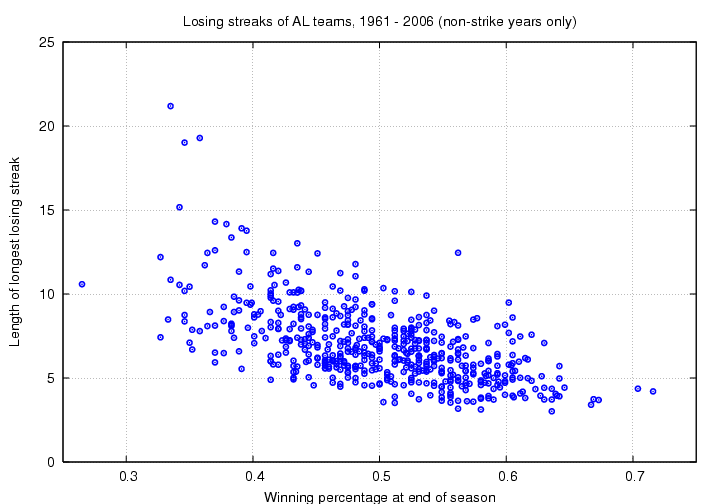
Now, for losing streaks; this looks very nearly like a mirror image, doesn't it?
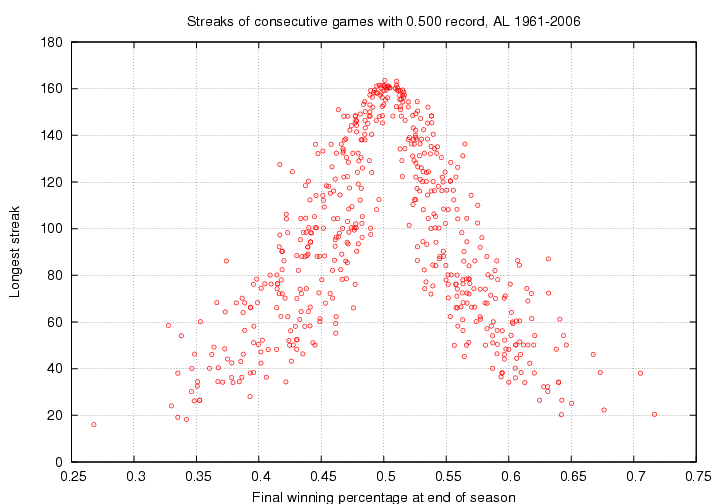
Let's move on to another sort of streak. Suppose we break a season up into periods we can call "hot" (winning more games than losing), "cold" (losing more games than winning) and "tepid" (winning and losing equal numbers of games). Do good teams -- that is, teams which finish with good winning percentages -- spend most of their time in the "hot" phase? Or do they go through a few short torrid streaks, interspersed between long stretches of lukewarmth? (I doubt that's a real word, but I like the look of it :-)
One way to test questions of this sort is to compute the longest stretch of games during a season during which a team has a winning percentage of exactly 0.500; in other words, the longest stretch of consecutive games during which the team wins and loses the same number of times. Note that a team which ends up with a record of 81-81 will, by definition, have a streak of 162 games of "exactly tepid" play. Here's a graph showing the results.
Another way of looking at the importance of streaks is to ask "For what fraction of the season was a team really hot (or cold)?" This is somewhat ambiguous. We can make it a bit more concrete by specifying what counts as "hot". I'll use the definition a team is hot when it is in the middle of a winning streak of at least 5 games. This is certainly not the ONLY definition one could pick, and it's quite probably not the best. But it is at least well defined.
So -- how does the time a team is "hot" correlate with its final record?
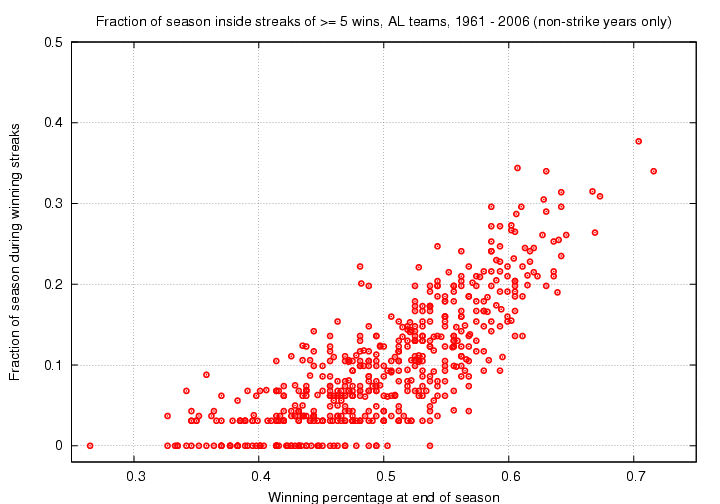
Using this definition, and the graph above, we can make statements such as
   Teams which end up with 97 wins (0.600 winning percentage)
   typically are "hot" for between 15% and 25% of the season.
Another question we can ask is, "Are good teams more (or less) consistent than mediocre ones?" That is, will a good team always win 6 out of every 10 games, or will it win 4 out of the first 10 games, then 8 of the next 10, then 9 of the next 10, then 3 of the next 10, and so on.
Measuring "consistency" is a tricky thing. Over what timespan do you compute some statistic? Which statistic should you pick? Should samples of games overlap or not? I don't know the right answers, but I took a shot. My method was:
So, for example, a team which ALWAYS won 6 out of 10 games, and so had winning percentages of 0.600, 0.600, 0.600, etc., would have a standard deviation of 0. Low values of this metric mean "very consistent play". On the other hand, a team which bounced back and forth between bad (winning 4 of 10) and very good (winning 8 of 10), with winning percentages of 0.400, 0.800, 0.400, 0800, etc., would have a standard deviation of 0.207. High values of this metric mean "varying levels of play."
I'll consider three sizes for the chunks into which I break the season: 10 games per chunk, 20 games per chunk, 30 games per chunk. Let's look at the results for each choice.
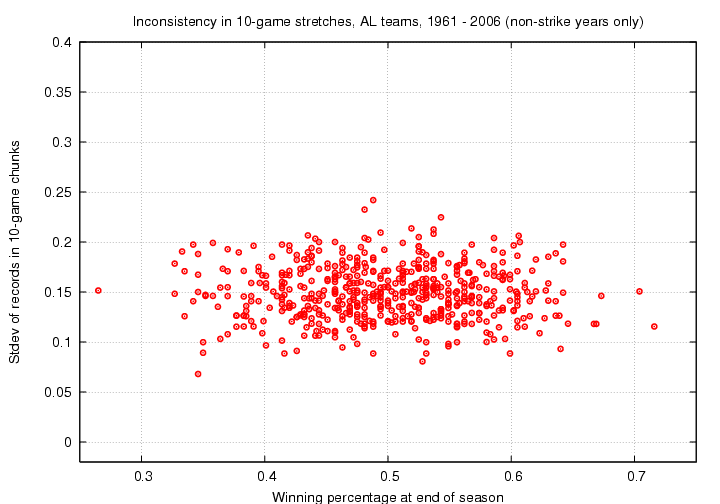
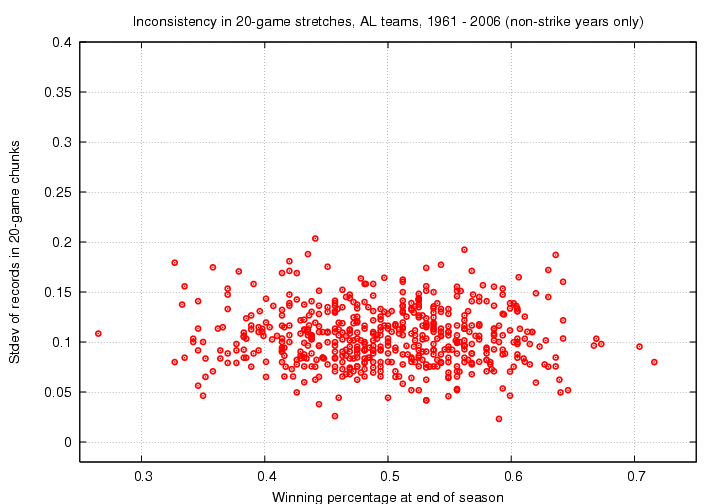
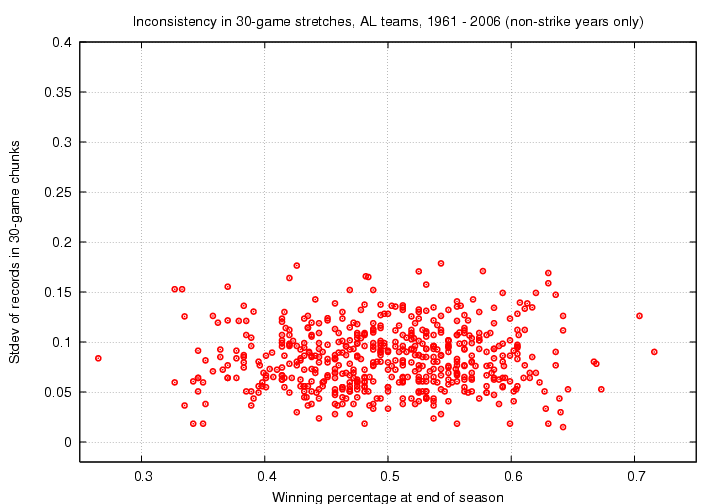
I think the conclusion is fairly clear: there is little correlation between a team's consistency and its ultimate record. Historically, some teams have managed to win a lot of (or few) games while being relatively consistent, while others have managed to win a lot of (or few) games while going hot and cold.
Note the general decrease in inconsistency as we increase the chunk size; just as a mathematician would expect.
Here are the datafiles, for interested readers:
Added Aug 10, 2007
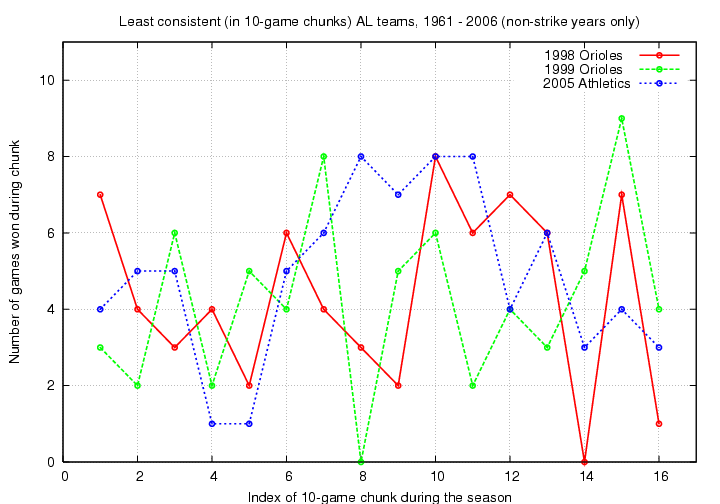
Which teams were the most and least consistent, using this metric? I chose chunks 10 games in length, and picked the top 3 "most consistent" and bottom 3 "most inconsistent" teams from the study period.
Here are the top 3, most consistent teams. The standard deviation from the mean number of wins within a chunk are 0.68, 0.81 and 0.89, respectively, for the 1970 White Sox, 1986 Blue Jays and 2004 Blue Jays. (Actually, there are three other teams with the same value of 0.89, the 1997 Tigers, 1968 Red Sox, and 2006 Yankees, but the graph becomes very messy if I include them). I show the 2007 Red Sox through 110 games as well; however, with a standard deviation so far of 1.3 games per chunk, they probably won't end up anywhere near the top of the list.
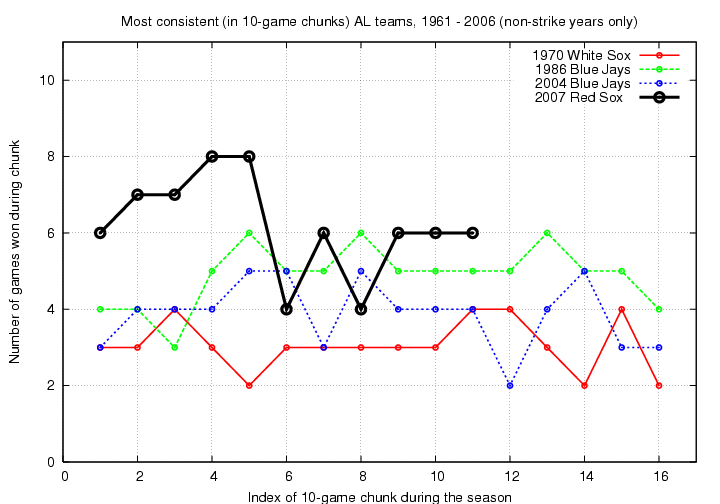
Now for the bottom 3 "most inconsistent" teams: the 1998 Orioles, 1999 Orioles and 2005 Athletics. Their values for stdev are 2.42, 2.32 and 2.25 wins per chunk, respectively.
 Copyright © Michael Richmond.
This work is licensed under a Creative Commons License.