Bill James found a relatively simple relationship between the number of runs a team scores (RS) and allows (RA), and that team's winning percentage:

The exact value of the exponent -- shown as "2" in the classic formulation -- is a matter of some debate (see the article by Davenport and Woolner for one example). There is no doubt, however, that the relationship does a pretty good job of predicting the actual winning percentage of real baseball teams. For example, consider teams in the major leagues' 2006 season.
#  Team                RS   RA   actual predict  error in
#                                  wins   wins   prediction
# ----------------------------------------------------------
NY_Yankees             930   767    97     96      1
Toronto                809   754    87     87      0
Boston                 820   825    86     81      5
Baltimore              768   899    70     68      2
Tampa_Bay              689   856    61     64     -3
Minnesota              801   683    96     94      2
Detroit                822   675    95     97     -2
Chicago_Sox            868   794    90     88      2
Cleveland              870   782    78     90    -12
Kansas_City            757   971    62     61      1
Oakland                771   727    93     86      7
LA_Angels              766   732    89     85      4
Texas                  835   784    80     86     -6
Seattle                756   792    78     77      1
NY_Mets                834   731    97     92      5
Philadelphia           865   812    85     86     -1
Atlanta                849   805    79     85     -6
Florida                758   772    78     80     -2
Washington             746   872    71     68      3
St._Louis              781   762    83     83      0
Houston                735   719    82     83     -1
Cincinnati             749   801    80     76      4
Milwaukee              730   833    75     70      5
Pittsburgh             691   794    67     70     -3
Chicago_Cubs           713   834    66     68     -2
LA_Dodgers             820   751    88     88      0
San_Diego              731   679    88     87      1
San_Francisco          746   790    76     76      0
Colorado               813   812    76     81     -5
Arizona                773   788    76     79     -3
Perhaps a graph shows the success of the formula more clearly.
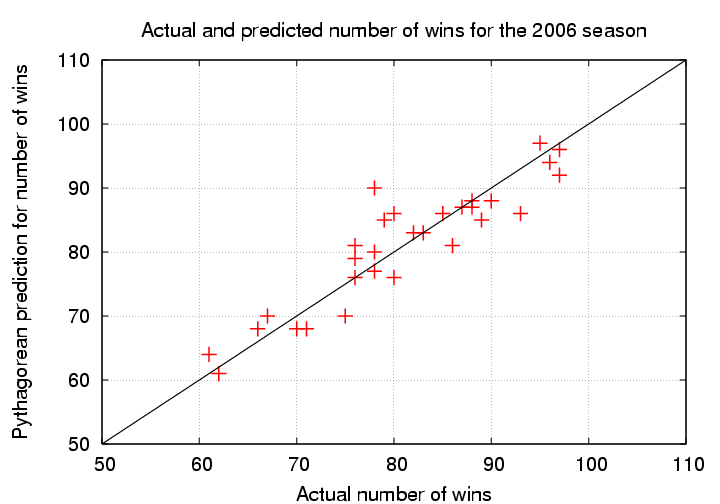
So, the formula does work. My question is -- should it work? That is, should there be any such simple relationship between runs scored, runs allowed, and winning percentage? More specifically, is such a formula a general rule, to be expected in all situations, or does it happen to hold only in a narrow set of circumstances (which, obviously, must include the real baseball world)?
There are many ways one might address this question. Some might involve very detailed calculations or play-by-play simulations of baseball games. I'm going to try a much simpler idea: generate only the final scores of a number of baseball games between two teams, according to a particular recipe, and then compare the actual won-loss record of each team to the Pythagorean prediction. The question is -- what recipe to use? We require
As a first attempt, let's try the Poisson distribution. It's a mathematical algorithm for predicting the number of discrete events (such as runs scored in a game) which will occur during some period, given the average rate of the events. It is also provided in many libraries of mathematical routines, so it's easy to find.
Is it really a good match the actual distribution of runs scored by real baseball teams? I happen to have the game scores for two seasons of the Boston Red Sox; let's see how well the real numbers compare to the Poisson distribution. The parameter λ for the Poisson function should be the average number of runs scored by a team per game, so
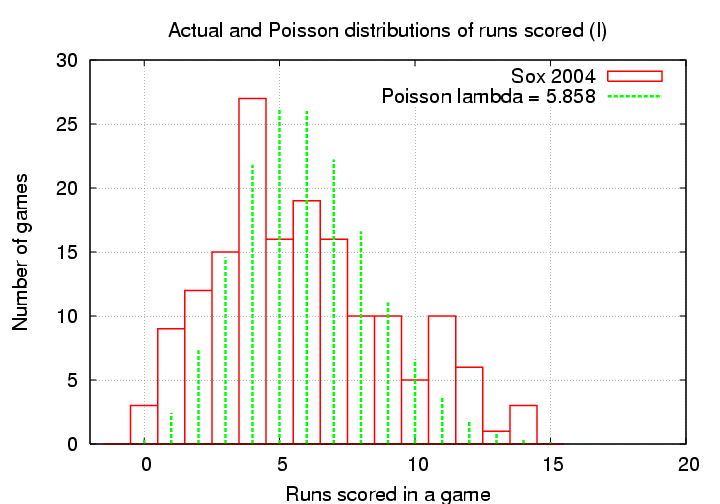
Hmmm. That's not a bad fit, but not a great one. The Poisson distribution fails at both ends: it predicts too few shutouts and too few blowouts.
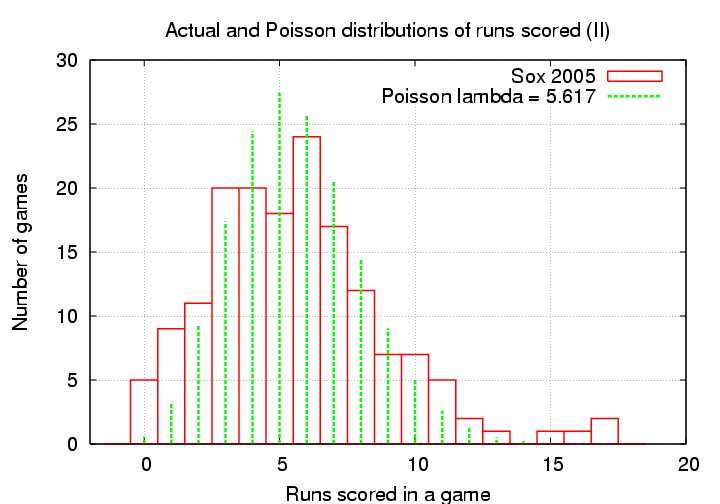
Once again, we see that the Poisson distribution is more sharply peaked than the real distribution.
Sigh.
The Poisson distribution isn't a great match, but let's go ahead and use it. I'll look for a better model a bit later ...
We'll start with a simple example: team A scores 6.0 runs per game (RPG) and team B scores 5.0 runs per game. Each team's scores are drawn from a Poisson distribution. The teams play a season of 162 games against each other. How many games does A win?
The Pythagorean theorem (with power 2.0) predicts that team A should win a fraction
               (6.0)2
           ---------------------   =  0.590
            (6.0)2 + (5.0)2
of the time; that adds up to 95.6 wins.
I wrote a little program to draw random values from
Poisson distributions (using routines from the
Gnu Scientific Library )
and simulate many seasons of this head-to-head matchup.
The simulations yield an average number of wins for team A
of 102 games, with a standard deviation from the mean of 6 games.
Thus, in the simulations, the high-scoring team wins more
games than predicted by the basic Pythagorean formula;
the difference between prediction and simulation is a bit
larger than the standard deviation in the simulations, too.
Hmmmm.
Suppose we try a different exponent: 1.8. Then the prediction is
                (6.0)1.8
           ------------------------   =  0.581
            (6.0)1.8 + (5.0)1.8
This is only slightly different, predicting 94.2 wins instead of 95.6. Note that this takes us even farther away from the simulation's average of 102 wins.
Do the simulations consistently differ from the Pythagorean predictions? Let's go back to the simple version of the Pythagorean formula with exponent p = 2.0. Suppose we look at a series of teams which always differ by exactly one run per game:
   team A RPG      team B RPG        Pythag A wins    sim A wins
  ----------------------------------------------------------------
       4.0            3.0               103.7           108.6
       4.5            3.5               100.9           106.1
       5.0            4.0                98.8           105.2
       5.5            4.5                97.0           104.0
       6.0            5.0                95.6           102.5
       6.5            5.5                94.4           101.7
  ----------------------------------------------------------------
When we consider a large number of situations, it helps to make a picture of the results. This graph shows the results of the simulations described in the table above. The number of wins predicted by the Pythagorean formula are a little bit different in the graph, because they are based on the actual number of runs scored per game in the simulation; the random number generator didn't always produce exactly 4.0 runs per game for one team over the course of 162 games, so I took the actual number of runs scored by each team for each simulated season and plugged into the formula.
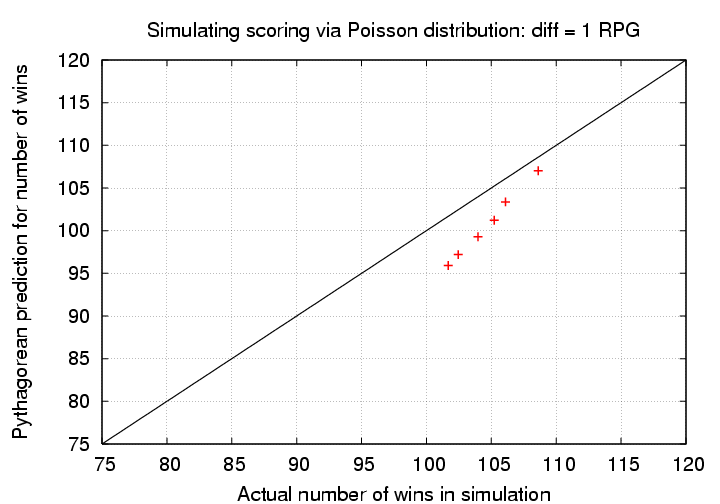
The Pythagorean formula (with exponent p = 2.0) always underpredicts the performance in the simulations of the high-scoring team; the difference appears to shrink as the winning percentage increases. In other words, the Pythagorean formula appears to do best when the typical scores are low, and, for a fixed difference of 1 RPG, the high-scoring team wins much more frequently than it loses.
Now, let's see if choosing a different exponent causes the formula to agree any better with the simulations.

Nope. No matter which exponent we choose, we find the same result: the Pythagorean formula underpredicts the number of wins by the higher-scoring team; for a fixed difference of 1 RPG, the formula does better when both teams score relatively few runs.
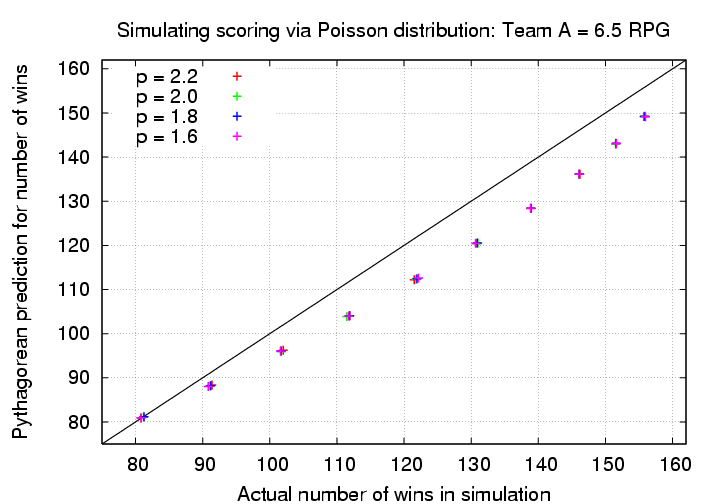
Let's slice the data in a different manner: suppose we focus one a team which has a fixed scoring rate -- say, 6.5 RPG. We'll vary the number of runs scored by the opposing team, from 2.0 RPG in steps of 0.5 RPG, until the opposing team reaches the same rate of 6.5 RPG. Again, we'll use the simple exponent p = 2.0 in the Pythagorean formula to start.
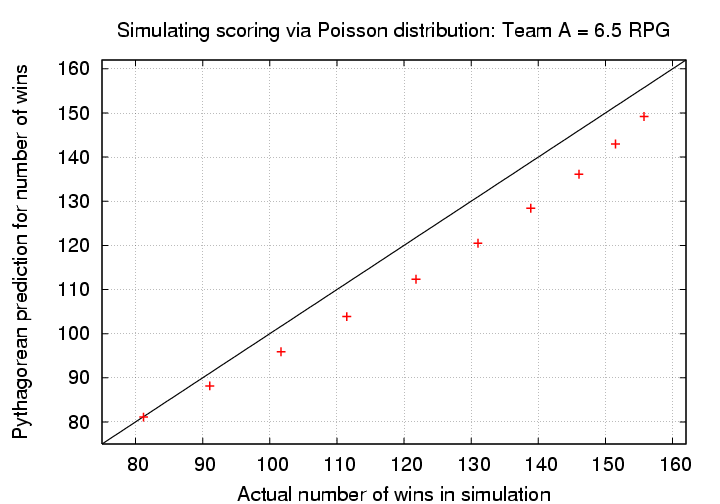
In this case, the formula matches the simulations well when both teams score at roughly the same rate; but when one team scores significantly more runs, the formula (as before) underpredicts the success of the high-scoring team.
Different choices for the exponent make no material difference in this discrepancy.
