 Copyright © Michael Richmond.
This work is licensed under a Creative Commons License.
A recent discussion on the Sons of Sam Horn website focused on the question, "How important is defense in baseball?" A good question.
Another recent discussion on the same website posed the question, "What makes a good discussion for baseball afficionados?" Some people brought up the topic of statistics: they can be good --- by inserting concrete foundations opon which opinions can be built --- but they can also confuse or scare off some readers.
I thought I'd try to contribute just a little bit to each of these discussions by writing a little report which tries to answer the question, "How important is X in baseball?" I'll use statistics to support my conclusions, but I'll try to explain how I use those statistics as I go.
First, I need to narrow the scope of the question. I will try to address the following question:
How much does X contribute to a team's winning percentage over the course of one season?
where I'll replace X with several factors, focusing on a team's offensive performance. (Yes, yes, I know that the original question mentioned "defense", but one of these items will touch on that issue).
Second, I need to define the scope of my evidence. I'll look at the performance of teams in the American League, over the period 1997 - 2006. Please note that some aspects of the game have evolved significantly since 1900, so my conclusions might not be valid for other eras of play.
Let's begin by looking at the winning percentage of every team in the AL during this period. I made a list of all 165 team-seasons in a semi-alphabetical order. Below is a graph showing the winning percentage of each one (vertically) and the position of each team in the list (horizontally).

I computed the mean, or average, value of winning percentage and printed its value in the lower-left corner of the graph. It should be exactly 0.500, but the lazy way I rounded off all values to three digits before averaging them caused the mean to be 0.501. Whoops. I should have been more careful. Still, you get the idea.
That label in the corner of the graph also includes the standard deviation from the mean. There are several ways to think of the standard deviation. Two of them are
In this case, the standard deviation in winning percentage is 0.080. I've drawn a shaded rectangle centered on the average value, with a height of 0.080 above the average and a depth of -0.080 below the average. If you count, you'll find that just about two-thirds of all the teams (110 teams) lie within the shaded region.
Now, what I plan to do is to correlate each team's winning percentage against some other facet of its play during each season. All this means is that I'll plot the winning percentages on the vertical axis, just as I did above, but I'll place that other quantity -- runs scored, or strikeouts, or whatever -- on the horizontal axis. I'll then examine the result within a narrow vertical window.
That quantity, the variation of winning percentages within a narrow window, is called syx. It is one of two quantities that I'll use to evaluate the importance of different baseball statistics.
The other quantity I'll use is called the coefficient of correlation, usually abbreviated as R. It has a meaning which is a bit difficult to define mathematically, but simple to see on a graph. It always falls somewhere within the range -1 ≤ R ≤ +1.
Phew. That's enough of math. Let's get back to baseball. Let's look at five ways to describe a team's performance.
Which of these are really important to winning a game?
For each of the 165 team-seasons, I counted the number of runs scored during the season. It ranged from a low of 575 (2002 Detroit Tigers) to a high of 1009 (1999 Cleveland Indians). Let me make a graph showing the winning percentage as a function of runs scored.

There's a clear trend in this relationship: the more runs a team scores, in general, the higher its winning percentage. If we fit a straight line to the points on this graph, we can describe this relationship mathematically:
(winning_percentage) = -0.000094 + 0.000623 * (runs_scored)
If we focus on a narrow vertical window on the graph, the scatter of points around this line is only syx = 0.0593. That's considerably smaller than the original standard deviation of the entire dataset, which was 0.080. If you compare the width of the shaded region in the two graphs, you'll see that the shaded region in this graph is narrow. That means that if you tell me how many runs a team scored, I can predict that team's winning percentage CONSIDERABLY MORE PRECISELY than I could without the extra information.
The correlation coefficient between winning percentage and runs scored is R = 0.670. It is positive -- more runs scored means more wins -- and pretty large, on a scale of -1 to +1. This is another indication that runs scored must be an important factor in winning baseball games.
As we move on to other statistics, I'll continue to provide the numerical values for syx and R, but I won't draw the shaded regions any more.
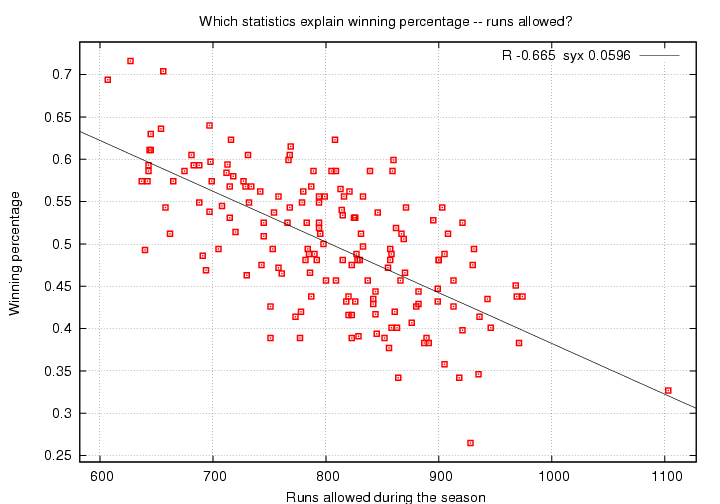
What about runs allowed by a team's pitching and defense? It seems obvious that a team which allows many runs won't win many games, but let's make a graph to check that intuitive guess.

Yup, we were right.
Hey, there's one team which allowed over 1100 runs in a single season -- that's more than 100 runs worse than any other team during the study period! Can you guess which team it was? The answer can be found elsewhere, but guess first.
In this case, the correlation coefficient R = -0.665 is negative -- more runs allowed means a smaller winning percentage -- but has roughly the same size as the correlation coefficient for runs scored. The scatter of values around the fit, syx = 0.0596, is also similar to the scatter around the fit to runs scored (which was 0.0593).
Hmmm. It appears that both scoring and preventing runs are important.
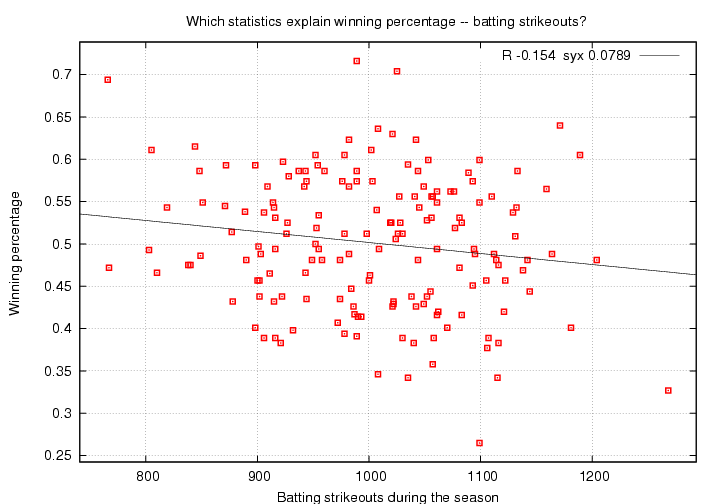
When a batter strikes out, fans groan and moan. Sluggers who lead the league in strikeouts year after year (Adam Dunn, Jack Cust, Rob Deer, etc.) are often scorned by radio talk-show hosts and baseball writers. But is a strikeout really that bad? Let's find out.

(Which team is that with 1268 strikeouts? Guess before you look. )
Here we see a negative correlation coefficient, meaning that strikeouts do tend to lower the winning percentage. However, the strength of the correlation is only R = -0.154, which is much smaller than the others we've seen so far. Moreover, the scatter of values around the fit, syx = 0.0789, is almost identical to the standard deviation from the mean in the original dataset, 0.080.
Knowing how many times a team's batter struck out doesn't really help us to predict a team's winning percentage.
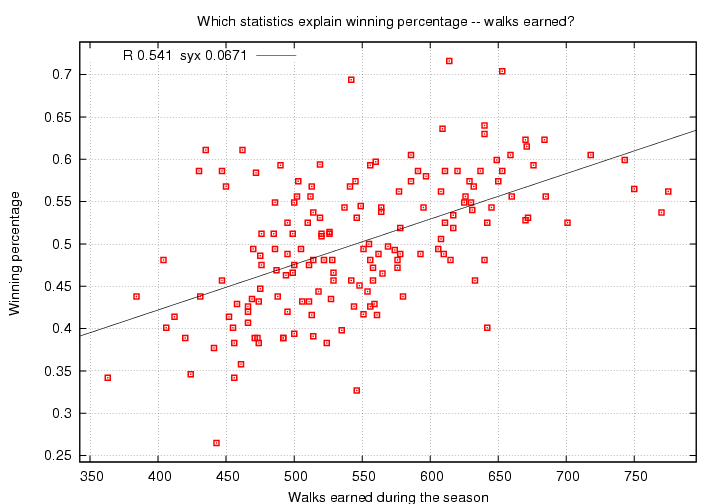
What about the flip side to strikeouts -- walks? If a strikeout isn't really so bad, maybe a walk isn't really so good. Let's see....

(Hey, this is the first of our statistics which varies by more than a factor of two from worst-to-best over the study period. Do you know which teams drew the fewest and most walks?)
Surprise! Walks do help a team win games. Well, that shouldn't be a surprise, but perhaps the strength of the relationship might be. This correlation coefficient, R = 0.541, is much larger than that for strikeouts; in fact, it's not all that much smaller than the coefficients for runs scored or allowed. The scatter of values around the fit, syx = 0.0671, lies roughly midway between the standard deviation from the mean in the original dataset, 0.080, and the syx values for runs scored and allowed.
Walks are important!
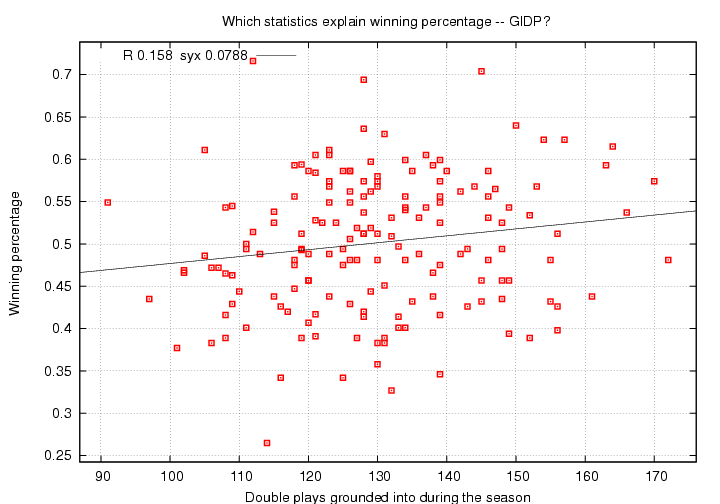
Strikeouts aren't good, but they don't seem to hurt a team's chances for winning too much. What about double plays? They sounds worse, but are they really?

(Who grounded into the most? Which team is that all but itself with only 91 GIDP? Don't peek! )
Huh?! More double plays means more wins???
Well, yes and no. From a statistical point of view, yes, there is a weak positive correlation (R = 0.158) between grounding into double plays and winning percentage. However, it is a very weak connection: note that syx = 0.0788, compared to an original standard deviation of 0.080. Knowing how many double plays a team suffered won't help you to predict their final record to any great degree.
But from a cause-and-effect point of view, NO! Double plays don't help you to win games; they kill promising innings and use up 2 of your precious 27 outs. So why do we see a positive correlation?
Correlation does not imply causation.
The reason we see a positive correlation is because the only way a team can ground into many double plays is if it has many runners on base. And teams which have many runners on base will, on average, score more runs and win more games than teams which don't have many runners. The increase in GIDP is a side-effect of putting many runners on base.
So, be careful: playing with statistics can lead you to improper conclusions if you don't use your common sense. In the words of IBM,
Let me put the results of this tiny little study into a table for easy reference.
| Quantity | |
|
| Runs scored | |
|
| Runs allowed | |
|
| Strikeouts | |
|
| Walks | |
|
| GIDP | |
|
I'd like to thank several organizations for making so much information about baseball available to everyone.
If you want to compute statistics yourself, you should really go the library and check out a good book or two; look in the index for linear regression. However, you can find many tools for computing statistics; you probably already own several. Most computers will have some sort of spreadsheet, and many calculators will do the sort of simple regression analysis that I've shown in this document. If you wish, you can see the source code (in C) to the little program I use all the time to compute simple straight-line fits to unweighted measurements.
Some answers to questions posed earlier.
The 1996 Detroit Tigers allowed 1103 runs. Ouch!
The 1996 Detroit Tigers also struck out 1268 times. Oh, brother.
 Copyright © Michael Richmond.
This work is licensed under a Creative Commons License.