Which team had the best offense in the history of baseball?
There are many different ways to rate the offensive performance of baseball teams. A simple way is to count the number of runs scored over the course of the season. If we try to compare teams over long periods of time, we need to normalize by the number of games played, since the season increased in length from 154 to 162 games in 1961. This leads us to compare teams by the number of Runs scored Per Game, or RPG for short.
So, which teams scored the largest number of runs per game? I'll consider only statistics from the "modern era" of baseball history, starting in 1901 and continuing to 2006. I will also restrict this study to the American League. Here are the top 10 teams by RPG:
Year      team runs     RPG
-----------------------------
 1930     NYY  1062    6.900
 1931     NYY  1067    6.880
 1936     NYY  1065    6.870
 1950     BOS  1027    6.670
 1932     NYY  1002    6.420

 1932     PHA   981    6.370
 1939     NYY   967    6.360
 1927     NYY   975    6.290
 1937     NYY   979    6.240
 1999     CLE  1009    6.230
-----------------------------
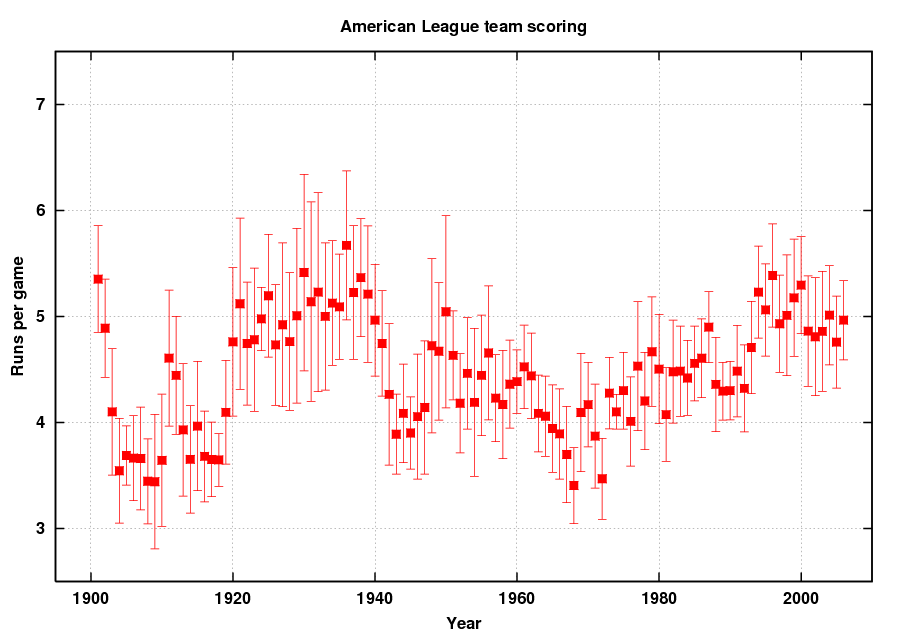
Does this mean that the 1930 Yankees were the most outstanding offense ever? Perhaps ... but perhaps not. Notice that 7 out of the top 10 teams played in the nineteen-thirties. This is not a coincidence. Over the decades, various aspects of the game have changed: new ballparks are built, different manufacturers supply baseballs, the height of the mound decreases, etc. Let's take a look at the average number of runs scored per game over the entire period of this study; you should see some clear trends.

The squares show the average number of runs scored per game for each year. Several regimes are obvious:
The errorbars attached to each square show the standard deviation from the mean value for each year; in other words, they provide a rough measure of the scatter in scoring for that year. If all the teams in some year had very similar values of RPG, then the errorbars will be small; for example, in 1960, the standard deviation was just 0.300 runs per game. If the spread in team scoring was large in some year (as in 1948, when the standard deviation was 0.822 runs per game), then the errorbars will be large.
It is clear that simply computing RPG won't tell us which teams are the most outstanding. A team which scored 5 runs per game in the nineteen-thirties was just average, while a team which scored 5 runs per game in the nineteen sixties would have been terrific. One way to account for the changing conditions and put all teams on an even footing is to compute a statistic which takes the number of runs per game above the average for that year, and normalizes it by the standard deviation for that year. In mathematical terms, we can compute a statistic I'll call D:
                 (team RPG) - (league average RPG)
         D  =   ----------------------------------
                    (league standard deviation)
For example, consider the 1975 Boston Red Sox. They scored 796 runs over 162 games, so achieving 4.980 RPG. The league average for 1975 was 4.300 runs per game, so the Red Sox were 0.680 runs above the average. The standard deviation from the mean that year was 0.362 runs per game. Thus, the 1975 Boston Red Sox had a D statistic of
                 (4.980 RPG) - (4.300 RPG)
         D  =   ---------------------------  =  1.878
                    (0.362 RPG)
A statistician might say that the 1975 Red Sox were 1.878 normal deviates above the mean number of runs scored per game.
By computing the D statistic for each team, we may possibly compare teams from different eras fairly. In essence, we are asking "How much did this team stand out above its peers?"
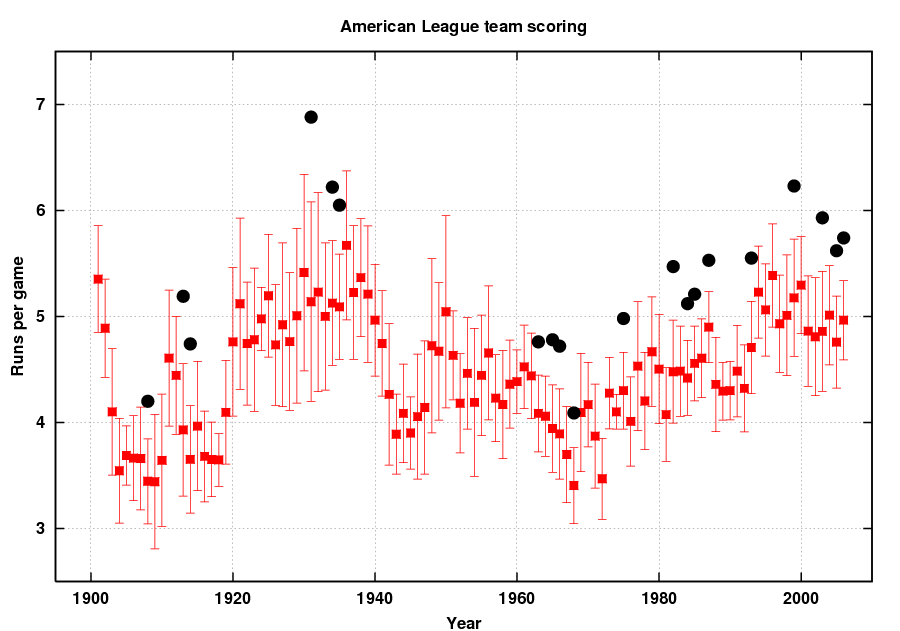
So, let's look at the top 20 teams in American League history according to this normalized statistic. First, I'll show them graphically, by plotting each team's location in the diagram you've seen before.

And now the list:
                        team    league   league
Year      team runs     RPG    avg RPG   stdev      D
-------------------------------------------------------
 1914     PHA   749    4.740    3.652    0.507    2.146
 2006     NYY   930    5.740    4.964    0.373    2.080
 1982     MIL   891    5.470    4.478    0.486    2.041
 1965     MIN   774    4.780    3.943    0.413    2.027
 1913     PHA   794    5.190    3.930    0.626    2.013

 2005     BOS   910    5.620    4.758    0.435    1.982
 1984     DET   829    5.120    4.420    0.354    1.977
 1966     BAL   755    4.720    3.892    0.426    1.944
 1993     DET   899    5.550    4.706    0.435    1.940
 1935     DET   919    6.050    5.091    0.497    1.930

 1968     DET   671    4.090    3.405    0.358    1.913
 1999     CLE  1009    6.230    5.176    0.552    1.909
 2003     BOS   961    5.930    4.859    0.567    1.889
 1987     DET   896    5.530    4.899    0.335    1.884
 1908     DET   647    4.200    3.445    0.401    1.883

 1975     BOS   796    4.980    4.300    0.362    1.878
 1963     MIN   767    4.760    4.085    0.362    1.865
 1934     DET   958    6.220    5.126    0.589    1.857
 1985     NYY   839    5.210    4.557    0.353    1.850
 1931     NYY  1067    6.880    5.139    0.941    1.850
-------------------------------------------------------
The 1931 New York Yankees fall from first (in raw runs scored per game) to twentieth (in normalized runs scored per game above league average). There is a nice mix of teams from different periods: 1 team from the 1900s, 2 from the 1910s, 3 from the 1930s, 4 from the 1960s, 1 from the 1970s, 4 from the 1980s, 2 from the 1990s, and 3 so far from the 2000s.
The "most outstanding offensive season" by this measure belongs to the 1914 Philadelphia Athletics. "Who were they? you might ask. I admit I didn't know myself. Take a peek at the starting position players (thanks to baseball-reference.com )
Pos Player              Ag   G   AB     BA    OBP   SLG    OPS+
---+-------------------+--+----+----+-------+-----+-----++----+
C  #Wally Schang        24  107  307    .287  .371  .404   137
1B  Stuffy McInnis      23  149  576    .314  .341  .368   117
2B *Eddie Collins       27  152  526    .344  .452  .452   176
3B *Frank Baker         28  150  570    .319  .380  .442   151
SS  Jack Barry          27  140  467    .242  .324  .268    81
OF *Eddie Murphy        22  148  573    .272  .379  .340   120
OF *Amos Strunk         25  122  404    .275  .364  .342   116
OF  Rube Oldring        30  119  466    .277  .308  .371   108
A second baseman who led his team in slugging? Nice. Eddie Collins had a great year, and made a heck of a 1-2 punch with Frank "Home Run" Baker. Of course, even Collins' stats this year pale next to those of Ty Cobb, who led the league in both slugging (0.513) and on-base percentage (0.466). Despite their all-time offense, the 1914 Athletics lost the World Series in four straight games to the Boston Braves.
The 1913 version of this Athletics team, by the way, was also very strong: they appear as number 5 in the list. They were mostly the same players, with Jack Lapp instead of Wally Schang behind the plate and Jimmy Walsh getting slightly more atbats than Amos Strunk. The 1913 Athletics did win it all, beating the New York Giants in 5 games.
From my own point of view as a Red Sox fan of the present age, I find it interesting to note
Is this the best way to rate all-time offenses? Well, probably not, but it seems to me at least a reasonable one. I have an idea for another scheme, but that will have to wait for another week.
Mod A: Excluding the top team itself
Vermonter at Large and Rice4HOF pointed out a flaw in my analysis: by including the top team each year in the calculation of mean runs per game and standard deviation thereof, we penalize truly outstanding teams to some extent. Why? If one team scores far more runs than all the others, then its performance will increase both the average and standard deviation significantly; then, when we subtract that average from the team's own number of runs per game, and divide the difference by the standard deviation, we diminish the value of D by which we are ranking teams.
Note that this effect will be larger when there are fewer teams: removing one team from the statistical calculations makes a bigger difference. Thus, using this small modification will bias the results towards teams which played in the "old days":
With this caveat in mind, let us repeat the calculations, but exclude the top team each year when computing the mean and standard deviation of runs per game. I'll call this modified statistic D'.
                 (team RPG) - (all-but-top-team league average RPG)
        D'  =   ----------------------------------------------------
                    (all-but-top-team league standard deviation)
Here are the top 20 teams ranked by D':
                        team    league   league           new   old
Year      team runs     RPG    avg RPG   stdev      D'    rank  rank
--------------------------------------------------------------------
 1914     PHA   749    4.740    3.497    0.273    4.553     1    1
 1913     PHA   794    5.190    3.750    0.393    3.664     2    5
 1935     DET   919    6.050    4.954    0.337    3.252     3   10
 1908     DET   647    4.200    3.337    0.280    3.082     4   15
 1965     MIN   774    4.780    3.850    0.307    3.029     5    4

 1934     DET   958    6.220    4.970    0.421    2.969     6   18
 1931     NYY  1067    6.880    4.890    0.674    2.953     7   20
 1907     DET   694    4.540    3.534    0.355    2.834     8   21
 1966     BAL   755    4.720    3.800    0.330    2.788     9    8
 1950     BOS  1027    6.670    4.811    0.674    2.758    10   25

 1939     NYY   967    6.360    5.047    0.480    2.735    11   26
 1968     DET   671    4.090    3.329    0.281    2.708    12   11
 2006     NYY   930    5.740    4.905    0.311    2.685    13    2
 1927     NYY   975    6.290    4.726    0.584    2.678    14   29
 1982     MIL   891    5.470    4.402    0.409    2.611    15    3

 1963     MIN   767    4.760    4.010    0.289    2.595    16   17
 1946     BOS   792    5.080    3.909    0.453    2.585    17   30
 1949     BOS   896    5.780    4.513    0.505    2.509    18   32
 2005     BOS   910    5.620    4.692    0.372    2.495    19    6
 1936     NYY  1065    6.870    5.500    0.549    2.495    20   34
--------------------------------------------------------------------
As expected, the modified statistic favors teams from small leagues. Note that the top team remains the same: the 1914 Philadelphia Athletics. The 1913 edition of the team now ranks second. The 2006 Yankees, on the other hand, fall from second to thirteenth.
Rice4HOF pointed out that the method I've chosen suffers from another statistical shortcoming: the number of teams is so small -- even in the current 14-team era -- that the standard deviation from the mean is not robustly determined. He suggested grouping together statistics from all the years within a particular period before computing statistics. I will take his suggestion and run with it a bit later ...
Mod B: Smoothing team statistics over several years
Several people have suggested that one can't extract reliable statistics on the mean and standard deviation of a distribution with only 7 or 8 samples; they have suggested that I group together a number of consecutive years worth of team statistics to compute the mean and standard deviation of runs scored per game, and then compute the normalized deviate. Good idea! Let's try it.
I'll choose boxcar smoothing (which gives equal weight to all values within a fixed span of years) and a full width of 5 years. Thus, for example, when evalulating the performance of the 1938 Yankees, I'll compute the mean and standard deviation of runs scored using all American League teams from 1936, 1937, 1938, 1939, and 1940. Note that teams at each end of our period of study, 1901-2006, will be compared to a smaller group; we don't yet know how many runs teams will score in 2007.
I'll refer to this statistic as Dsmooth.
                 (team RPG) - (5-year-boxcar average RPG)
   D        =   ----------------------------------------------------
    smooth          (5-year-boxcar standard deviation)
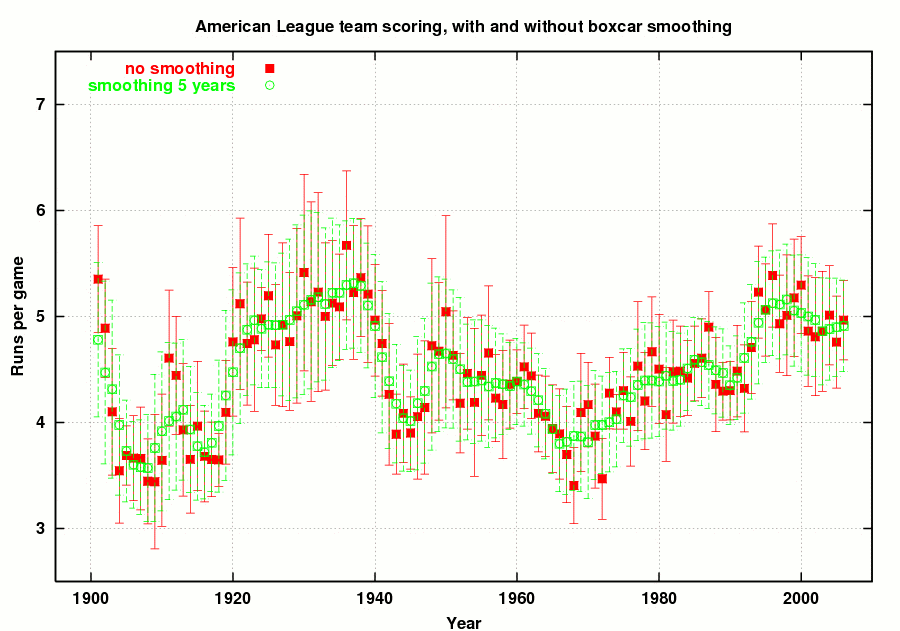
First, let's look at the graph of runs scored per game, using all teams. I show the mean and stdev computed using individual years in red, and using 5-year groups in green.

Warning Will Robinson! Note that this method of computing statistics will give improper weights to teams during years when the overall face of baseball was changing rapidly. For example, look at the brief peak in runs scored for 1911 and 1912. When we smooth over 5 years, the sudden jump of one full run per game from 1910 to 1911 is moderated; we will be comparing each team's performance in 1911 to an artificially lower average performance. Instead of subtracting 4.607 runs per game (the average in 1911 alone) from each team's performance, we will subtract only 4.013 runs per game (the average over the period 1909 to 1913). This will favor teams during rising periods of scoring, and punish teams during falling periods of scoring. Keep this in mind...
Here are the top 20 teams ranked by Dsmooth:
                        team   5-year    5-year  D
Year      team runs     RPG    avg RPG   stdev    smooth
--------------------------------------------------------
 1950     BOS  1027    6.670    4.650    0.702    2.877
 1936     NYY  1065    6.870    5.296    0.606    2.597
 1987     DET   896    5.530    4.543    0.410    2.407
 1915     DET   778    4.990    3.776    0.509    2.385
 1982     MIL   891    5.470    4.392    0.464    2.323

 1999     CLE  1009    6.230    5.055    0.524    2.242
 1911     PHA   861    5.660    4.013    0.741    2.223
 1907     DET   694    4.540    3.579    0.446    2.155
 1939     NYY   967    6.360    5.103    0.588    2.138
 1956     NYY   857    5.560    4.338    0.574    2.129

 2003     BOS   961    5.930    4.860    0.504    2.123
 1996     SEA   993    6.170    5.124    0.494    2.117
 1930     NYY  1062    6.900    5.110    0.847    2.113
 1921     NYY   948    6.200    4.700    0.710    2.113
 1931     NYY  1067    6.880    5.157    0.839    2.054

 1961     DET   841    5.160    4.358    0.393    2.041
 1965     MIN   774    4.780    3.935    0.415    2.036
 2004     BOS   949    5.860    4.881    0.481    2.035
 1966     BAL   755    4.720    3.799    0.453    2.033
 1927     NYY   975    6.290    4.923    0.673    2.031
-----------------------------------------------------------
Wow. This is quite a change from our previous lists. The 1913 Philadelphia Athletics drop to number 47 overall, and the 1914 Athletics rank is 97! The 1911 edition of this dynasty now comes to the fore, reaching number 7 in Dsmooth, but in large part due to the overall jump in scoring from 1910 to 1911.