 Copyright © Michael Richmond.
This work is licensed under a Creative Commons License.
Copyright © Michael Richmond.
This work is licensed under a Creative Commons License.
Hitting a baseball (safely) is often said to be the most difficult challenge in the major team sports: even the best batters fail more than half the time. It takes years of practice and lightning-fast reflexes to swing a thin cylinder of wood into the center of a speeding ball less than three inches in diameter. Common sense dictates that a good batter's vision must be nearly perfect: Ted Williams, for example, had 20/10 acuity, and Gregg Jeffries could read numbers written on pitched balls before he struck them.
It would be impossible, then, for a batter to make solid contact if his eyes were closed -- right?
Well, no, actually. A recent article in the journal PLOS ONE describes experiments which show that as long as a batter can see the first half or so of a pitch's trajectory, he can still put the bat in the right place.
The authors of this study, Contribution of Visual Information about Ball Trajectory to Baseball Hitting Accuracy, are a group of sports scientists in Japan. The lead author, Takatoshi Higuchi, works at Ritsumeikan University in Kyoto, while his co-authors are based in Waseda University, Nara Women's University, and, in the case of former Japanese big-league pitcher Masakazu Watanabe, Fukuoka University. Their research was supported by the Japan Society for the Promotion of Science, which -- disclaimer -- has kindly funded some of my own collaborations with Japanese scientists.
The basic setup was simple: the scientists placed a pitching machine at the same distance from home plate as a real human's release point, and trained it to throw balls with a standard, repeatable speed and spin. They put a good college player into the batter's box and gave him some practice swings. When he was ready, they started the experiment proper.
Each batter was given 36 hits. Before each pitch, a computer chose at random one of three conditions and sent a signal to a special set of eyeglasses that the batter was wearing. Under the first condition, called "NO", the lenses acted like plain old transparent glass, so the batter could see the ball for its entire trajectory. Under the second condition, called "R+150", liquid crystals in the lenses would become opaque exactly 150 milliseconds after the ball left the pitching machine; thus, the batter would see only the initial behavior of the pitch. For the final condition, "A-150", the lenses would turn opaque 150 milliseconds before the ball reached home plate; this blocked the batter's view of the final portion of the pitch.
Batters had no idea how their eyeglasses would behave during each pitch. The computer modified its random selections slightly so that each batter would get 12 hits under each condition.
After throwing 36 pitches at a fixed speed, the pitching machine was instructed to switch to a second speed for a second set of 36 attempts. The two choices were a "changeup," at 71.8 MPH, and a "fastball" at 90.7 MPH; each had backspin of 1836 RPM, typical for professional levels of competition. Some participants saw the changeup first, others the fastball.
Let's begin with a brief description of what a batter would see under ordinary conditions. You can read a detailed description of the calculations used to create these figures if you wish; in short, I numerically integrated the motion of a ball with the properties described in Higuchi et al., giving it the initial directions necessary to yield a strike on the outer half of the plate. The time required for the ball to reach the batter in my simulations agrees well with the times recorded in the study, differing by 22 milliseconds for the changeup and much less for the fastball.
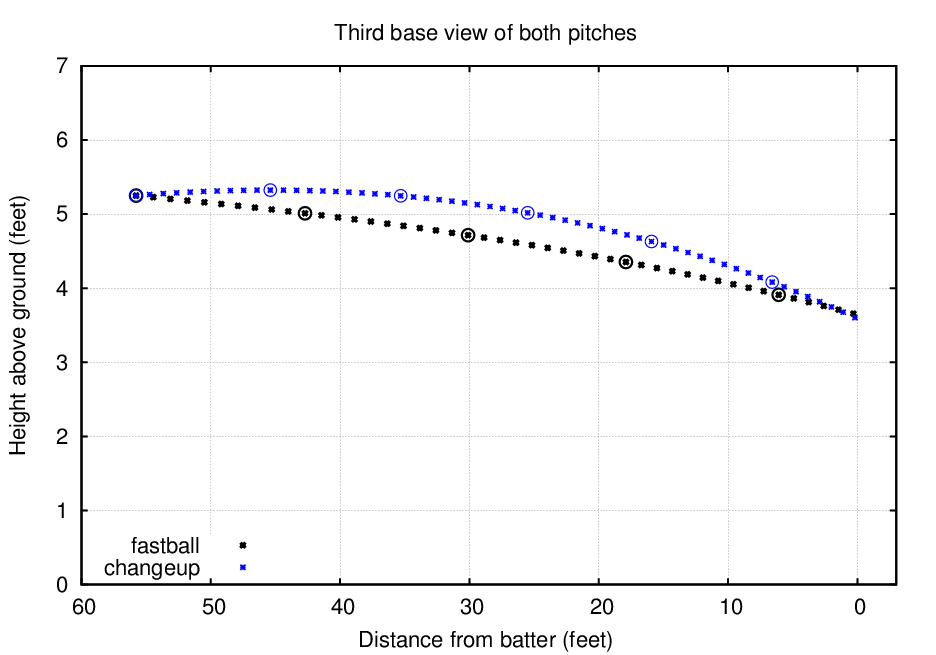
The figure above shows the trajectory of each type of pitch. Symbols appear every 0.01 second (10 milliseconds), with a large circle marking the location every 0.1 second. As you can see, the fastball takes a nearly direct route toward the strike zone, while the changeup follows a graceful arc to reach the same end point. The combination of its longer path and slower speed cause the changeup to take roughly an extra tenth of a second to reach the batter.
How much of these trajectories did the batters see during the experiment? Let's first examine the fastball.
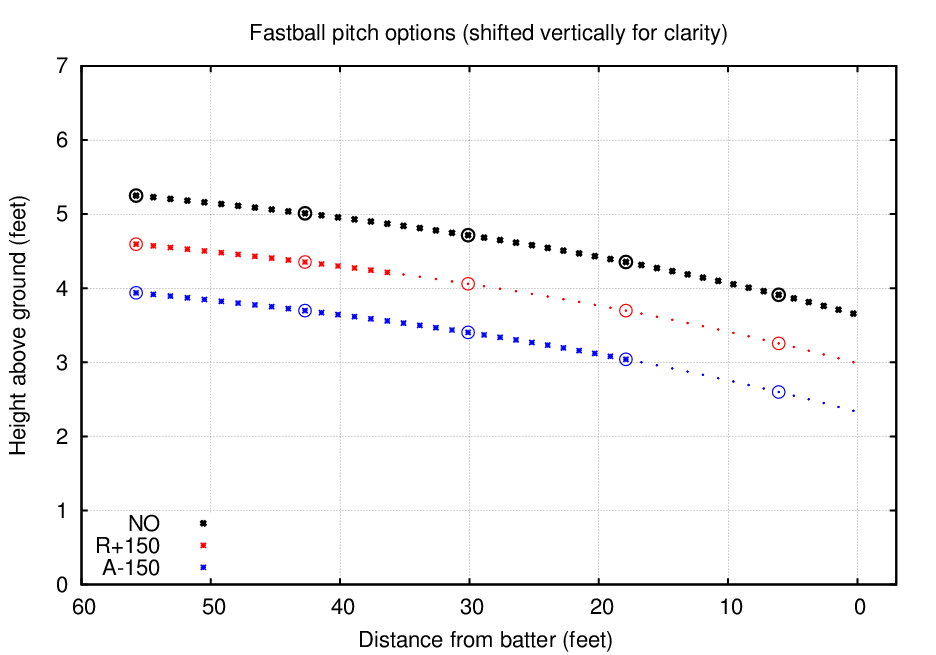
The figure above shows the three options, using big, bold symbols to denote when the ball was visible, and small dots to indicate times when the batter could not see the ball. In the "R+150" case, the batter could see only the first one-third of the pitch!
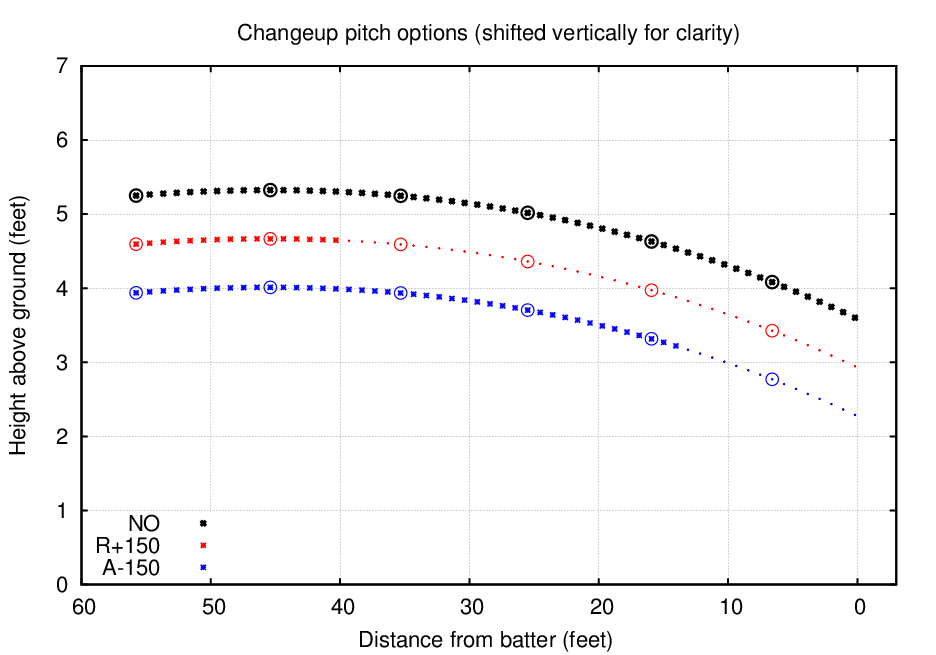
The situation was even more extreme for the changeup: nearly three-quarters of the motion was invisible under the "R+150" option. Note that the difference between the "R+150" and "A-150" cases is larger for the changeup than the fastball; does that mean that the performance of batters will show a larger gap, too?
That brings up a good question: just how can one measure quantitatively the batter's ability to strike the ball? In an ordinary game of baseball, we allow the batter to hit the ball into a large playing area, dotted here and there with fielders, and count the number of times the batter can run to first base before a fielder can catch the ball or throw him out. There are so many variables -- where are the fielders positioned? how fast is the batter? are other runners on base? which way is the wind blowing? -- that it takes hundreds and hundreds of trials to determine with any precision just how well the batter did.
To save time and the effort of organizing an entire team of fielders, Higuchi and his collaborators devised a simple way to measure the quality of contact between bat and ball. They marked the "sweet spot" of their bats with a target and asked the batters to make contact at that location. Using high-speed cameras, they then filmed each swing and determined the offset between the target and the actual spot at which the ball touched the bat.
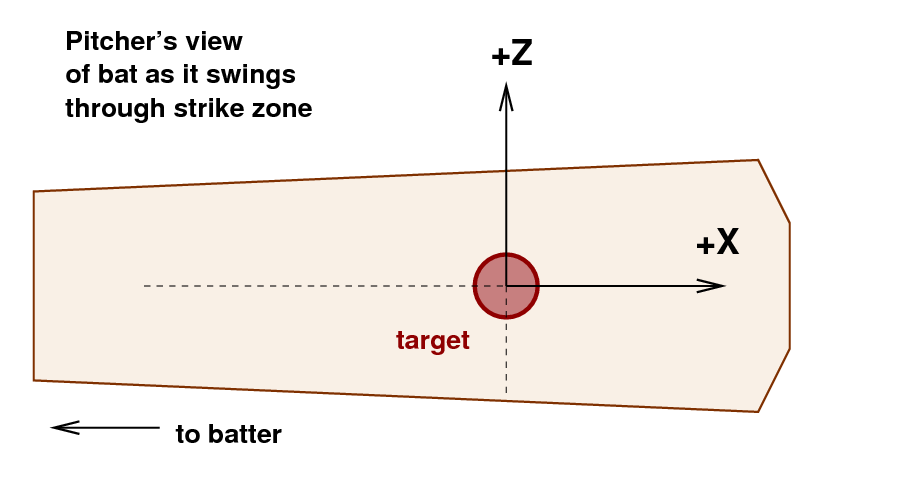
This difference between target and actual contact location will stand for the quality of the swing. If the batter strikes the ball close to the target, the ball will rebound nearly straight out into the field at high speed: a line drive and likely hit. If the batter makes contact far from the target, the ball will bounce off with less energy, often at an acute angle, turning into an easy fly ball or ground out.
(The authors also recorded the position of the point of contact in a third dimension -- the distance forward from the point of home plate toward the pitcher's mound -- but I'll omit those measurements here, as they weren't very informative.)
The big question thus becomes: will batters whose view of the ball is interrupted be able to square up and make contact as close to the target area as those who can see the entire trajectory?
Let's examine the results first in pictorial form. The figures below are taken directly from the article by Higuchi et al., specifically, their Figure 2. Consider first the "changeup" pitches. Each panel below shows the offset between contact and target for each pitch; each batter is identified by a different color. The large red diamond shows the mean location, and the black errorbars the standard deviation from the mean.
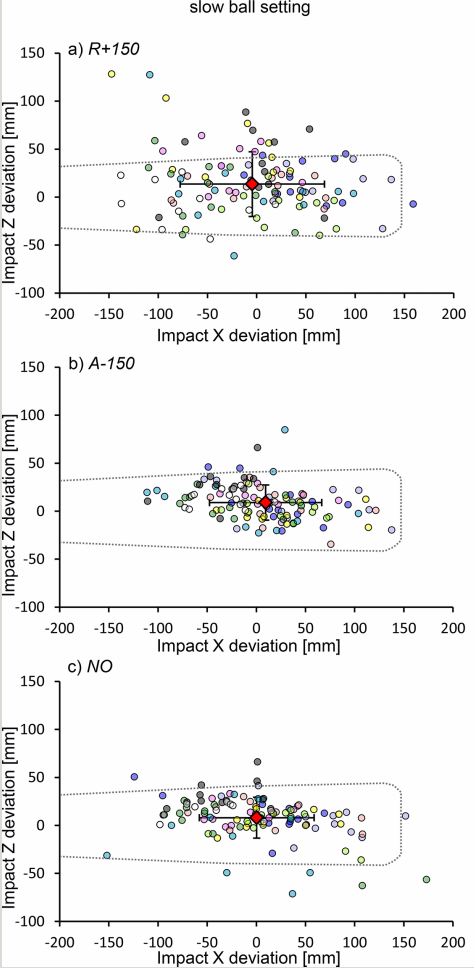
The top panel, corresponding to trials when the batters' view was blocked 150 milliseconds after release ("R+150"), is peppered by symbols in all directions, with a wide scatter. The middle panel, showing trials when the view was blocked 150 milliseconds prior to the ball's arrival ("A-150"), has a much tighter distribution, especially in the vertical ("Z") direction. The bottom panel, for trials when the batters suffered no visual impairment ("NO"), doesn't look all that different from the middle one -- does it?
Hmmm. It seems that batters did not gain much advantage from seeing the ball as it covered the final 15 feet or so of its journey. Could that really be true?
Well, we can examine the results of the "fastball" pitches to check. Once again, the figure is taken straight from the original article.
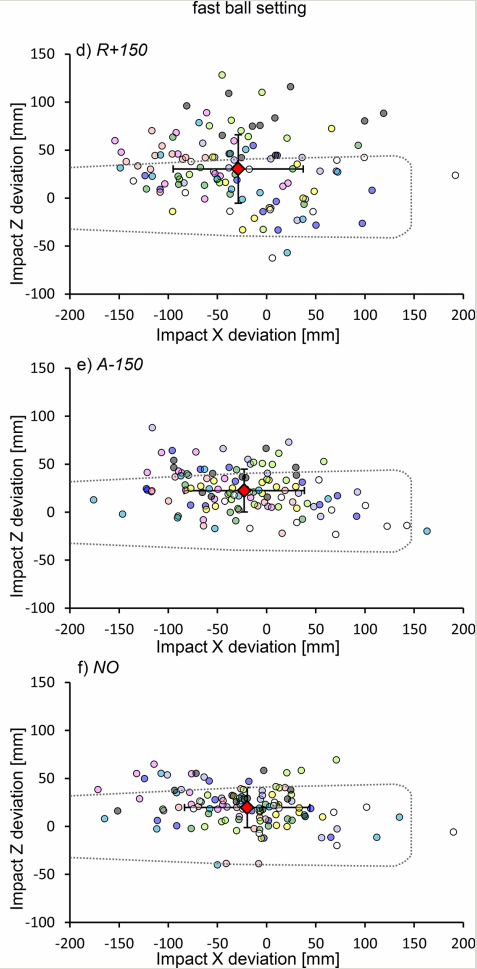
There are some small differences between this figure and the previous one. If you look carefully, you can see that the mean location for contact with the fastball was consistently higher on the bat -- farther above the midplane -- than it was for the changeup. That's not a big surprise; after all, a good fastball with plenty of backspin will drop less than batters expect, which is why power pitchers tend to get a lot of fly ball outs. The overall scatter is also somewhat larger for the fastball than the changeup; again, just as one would expect.
But the most interesting aspect of these results is the same pattern seen earlier: the quality of contact under the "A-150" condition is roughly equal to that of the "NO" condition, while the quality is lower for the "R+150" trials. Moreover, the difference in quality appears most clearly in the vertical ("Z") direction.
Higuchi et al. perform a number of statistical tests on these results, but the bottom line is pretty simple. In the authors' own words,
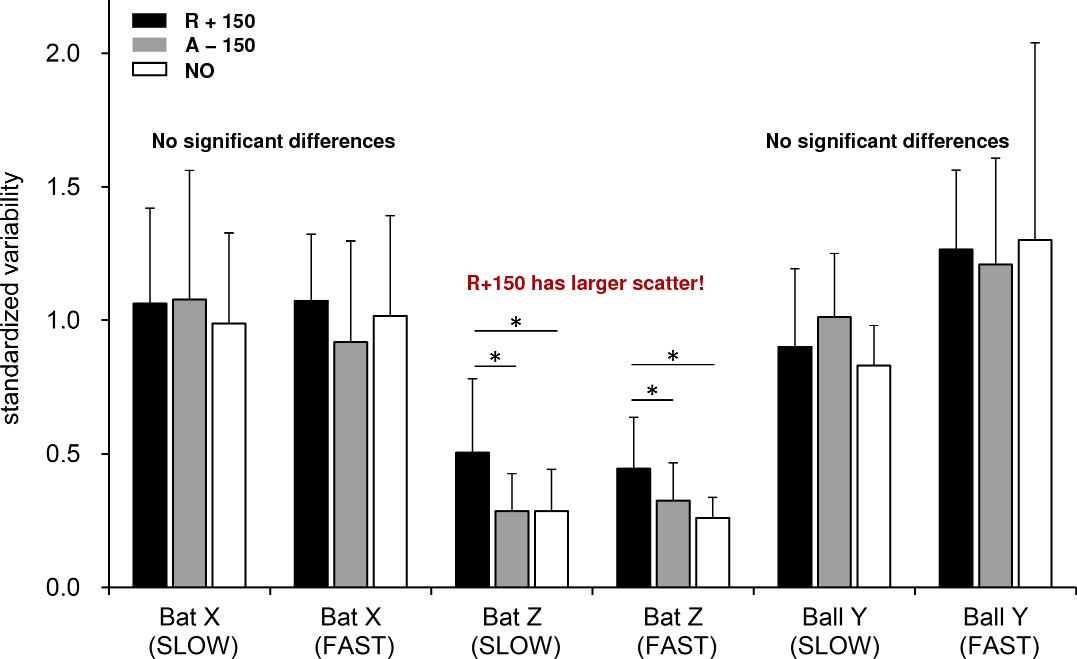
Post hoc multiple comparison tests for the variability of impact Z deviation under the slow ball and fast ball settings showed that the standardized variability of impact Z deviation was significantly larger under the R+150 condition than under the A-150 (p < 0.05) and NO (p < 0.05) conditions.
If you prefer graphics to words and numbers, just take a look at Figure 4 from the article (to which I've added a few annotations):
One of the simplest ways to summarize this experiment is "batters learn more from seeing the early portions of a pitch than the late portions." This wasn't unexpected. After all, people have known for many years that a batter needs to make up his mind to swing or take a pitch long before it reaches him. Recall that a fastball reaches the plate about 0.45 seconds after it leaves the pitcher's hand. Since it takes a batter about 0.23 seconds to accelerate the bat from rest to maximum speed while moving it into the path of the ball, he needs to make the decision to swing at most 0.22 seconds after the release. In other words, during this brief period, the batter must be able to predict the final location of the ball accurately enough to know "I should starting swinging now," as well as "I should put the bat about two inches below my belt for this one."
There are good physiological reasons why humans key on the early part of the trajectory: it's the only portion we can see clearly. "What?" you may say, "Isn't the ball harder to see when it's far from the batter?" Well, yes, it does appear smaller, that's true. But during the first half of its trajectory, the ball is moving slowly in apparent angular position. Look at the diagram below, which shows a batter's-eye view of incoming pitches.
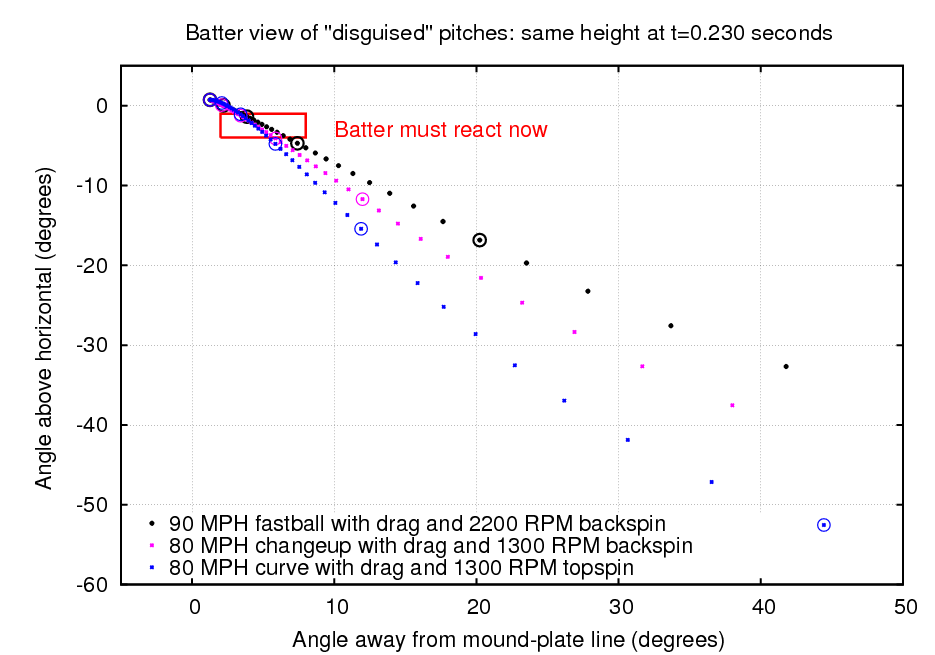
This is an "angular position" diagram, showing the angular displacement of the ball away from the release point. Both horizontal and vertical axes are marked in degrees; a value of -90 on the vertical axis, for example, would mean that the batter was looking down at his feet. As in earlier diagrams, dots mark the progress of the ball at intervals of 0.01 seconds.
Note that during the first 0.23 seconds of the ball's journey, before it reaches the red box, it moves by less than ten degrees: the ball just grows larger and larger as it comes nearly straight at the batter. It's easy for human eyes to follow the ball at this time. But as the ball comes closer, its angular position changes more and more rapidly; the fastball is moving by nearly ten degrees in the final 0.01 second as it crosses the plate. The eyes simply can't keep up with it, even if the batter twists his head to help. If, by some miracle, a batter could see the ball clearly 0.01 second before it hit the bat, the visio-motor delay (there's a fancy term I learned from this article!) would prevent him from making any adjustments.
Sports scientists have known for quite some time that batters of all sorts -- including those who play cricket as well as baseball -- must be basing their actions on the early segments of the ball's motion. This study, however, provides precise, quantitative measurements of the phenomenon.
What other conclusions can we draw from this experiment? If you look at the "location-of-contact" graphs again, you'll see that the points spread out farther in the X direction (along the horizontal axis of the bat) than they do in the Z direction (in the vertical direction). The authors note that errors in the timing of a swing cause relatively large deviations from the target in the X direction (swing too late, for example, and the ball will strike closer to the handle) but only small deviations in Z (since the swing is relatively level through the strike zone). However, small errors in the timing are less critical to success than small errors in vertical position of the bat: a deviation of 60 mm in X may simply send the ball to right or left field, rather than up the middle, and still result in a hit. A deviation of 60 mm in Z, on the other hand, may lead to a pop fly or grounder. Timing the swing correctly may be one of the most difficult aspects of hitting, but, fortunately, it is at least somewhat forgiving.
If one looks very carefully at the "location-of-contact" graphs for the R+150 condition, one will see that the scatter in the Z direction is a bit smaller for the changeup than the fastball. The authors infer that batters used the extra time (about 0.10 seconds) before the ball's arrival to decide more accurately when and where to swing. They therefore agree with earlier studies that swinging motions which require less time (due to high accelerations and/or compact trajectories) will lead to more success:
the present result supports the idea that a shorter swing time and faster bat swing speed are beneficial for successful hitting because a longer time is available for making these decisions
Copyright © Michael Richmond.
This work is licensed under a Creative Commons License.