 Copyright © Michael Richmond.
This work is licensed under a Creative Commons License.
Copyright © Michael Richmond.
This work is licensed under a Creative Commons License.
So, you've built a telescope. Okay, now what? You'll need to put some sort of instrument near the focal point to measure the light which the mirror collects. What are the possibilities?
Let's compare records made by each instrument of one particular object, the Helix Nebula (NGC 7293).
First, a sketch based on the visual appearance in an eyepiece:

Sketch by
John A. Blackwell
Next, a picture taken by a CCD camera; several images taken through different filters have been combined to create a false-color picture.

Image credit: NASA,
WIYN,
NOAO,
ESA,
Hubble Helix Nebula Team,
M. Meixner
(STScI),
and T. A. Rector
(NRAO)
Finally, here are three spectra showing the emission as a function of wavelength from the gas at three positions in the nebula.

Figure taken from
Warner and Rubin, ApJ 198, 593 (1975)
Gee, the spectra don't look at all like the records produced by the two other instruments. What's going on? What does a spectrograph do?
A spectrograph takes light from a source and separates it by wavelength, so that the red light goes in one direction, the yellow light in another direction, the blue light in another direction, and so forth. There are two basic ways of dispersing light. You can pass it through a prism
or you can bounce it off (or pass it through) a diffraction grating
  Q:  Most astronomers these days use gratings,
      not prisms.  Can you guess why?
You can read about the physics of diffraction gratings if you want to understand exactly how and why they work.
If you just attach a grating (or prism) to your telescope, so that light from all over the field of view strikes the grating (or prism), you will see a somewhat confusing combination of image and spectrum together:

Astronomers often place a slit over the focal plane of the telescope, centered on the object of interest.
Only light which passes through this slit will strike the grating (or prism), giving the spectrum a characteristic shape: vertical lines on a long, horizontal canvas.
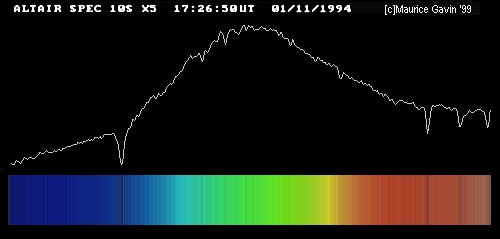
Image by Maurice Gavin, from the wpo-amateur spectroscopy web site.
When we pass light from a source through a spectrgraph, we usually see one of three basic types of spectrum, depending on the nature of the source. German astronomer Gustav Kirchoff, working in the 1850s, figured out the reason for these different types of spectra. He explained the three basic types of spectra as coming from three different situations:
![]()
![]()
![]()
Each element generates its own unique set of wavelengths of emission or absorption.
We can use these patterns like fingerprints to identify the material which is emitting or absorbing light.
Copyright © Michael Richmond.
This work is licensed under a Creative Commons License.