 Copyright © Michael Richmond.
This work is licensed under a Creative Commons License.
Copyright © Michael Richmond.
This work is licensed under a Creative Commons License.
There are a lot of useful tools that can help you to locate astronomical information, or to make sense of it once you've found it. Let's look at a few.
Back in the old days, we had to use books which contained indexed lists of all the papers published each year. Look up the author's name in the book, write down a list of his works on a piece of paper, walk over to the shelves with the journals, find the proper volume and page ... and then find out that it wasn't the paper one wanted. Oh, the agony.
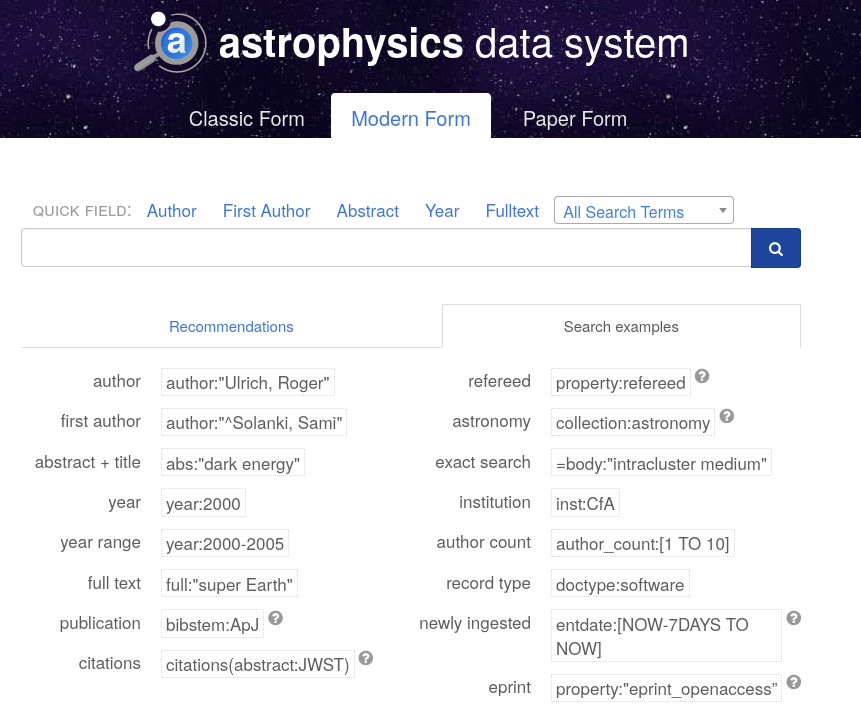
Fortunately, thanks to grants from NASA, it's all very easy now: just go to the
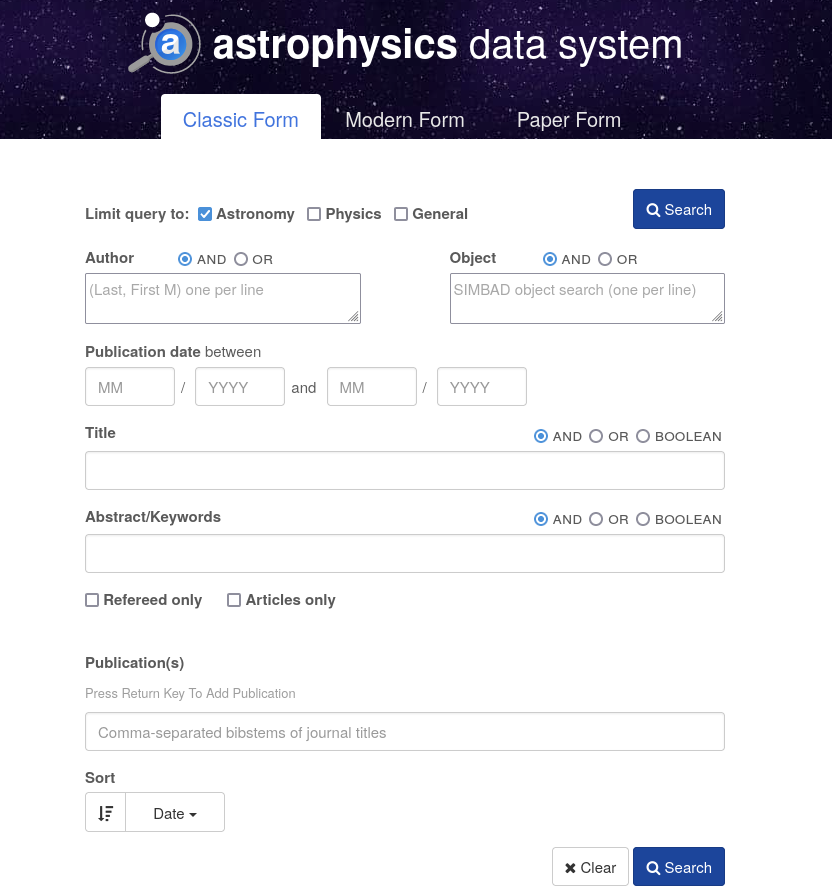
Oh, you want the
MODERN version?
This site will let you search by author, by object name, by title, by words in the abstract, or even within the full text of each paper. Just fill in the appropriate boxes and press the Send Query button. You'll receive a list of the most relevant papers. In most cases, you can read the abstract of each item to find out if it's really what you want. If it is, you'll often be able to read the entire text of the paper, either by clicking on the link leading to its official appearance in a journal, or, if not, by choosing the arXiv.org link as a second choice.
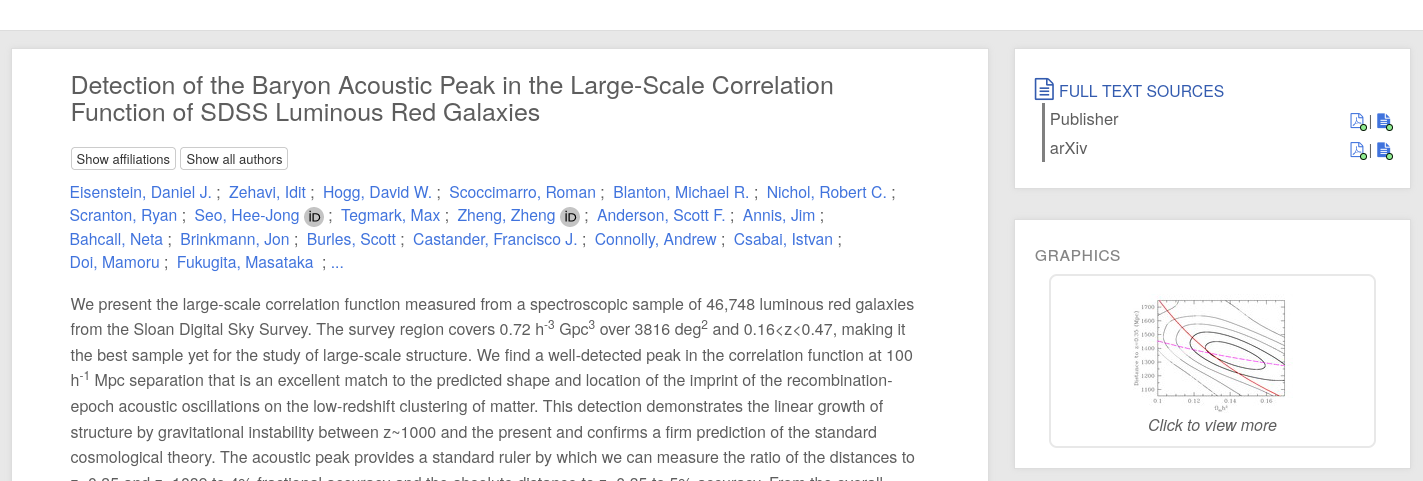
If the article in question is very recent, it might not have been published officially yet, but it might appear on the arXiv.org preprint site.
Another good source for additional reading can be found in good old SIMBAD, which provides a list of references to objects in the literature. Just scroll down a bit in the results page.
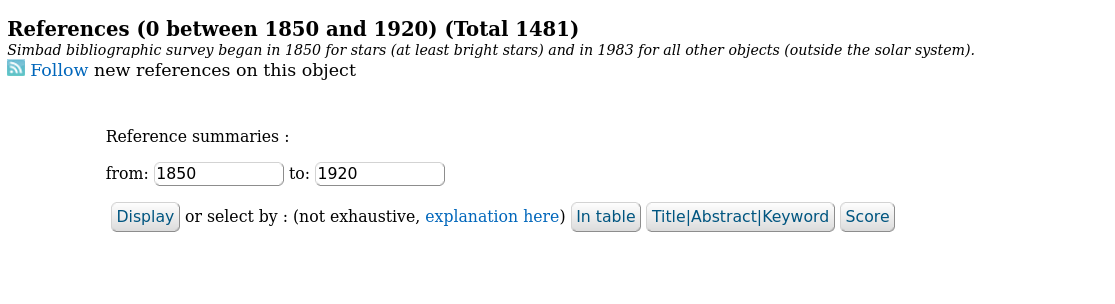
  Q:  What do we know about PAHs in the
      galaxy NGC 4125?


  Q:  What is the earliest use of the
      term "Hubble's constant" you can find?


  Q:  Who were the earliest astronomers to describe the variable
      spectrum of the central source in the Keyhole Nebula?
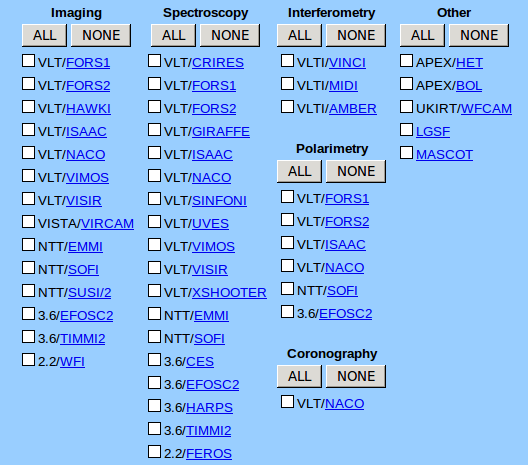
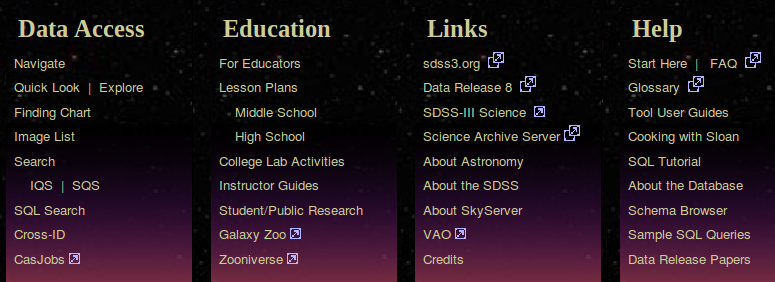
Thanks to the low cost of disk space and the wonders of the Internet, astronomers can now access a great deal of data which has accumulated over the years. There are many websites which allow access to individual datasets, and a few which perform searches over many different datasets. I find the following most useful -- but I'm always on the lookout for additional sources.
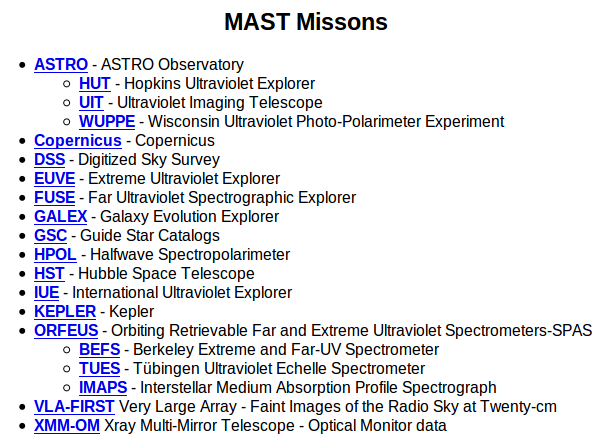
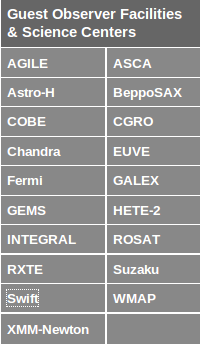
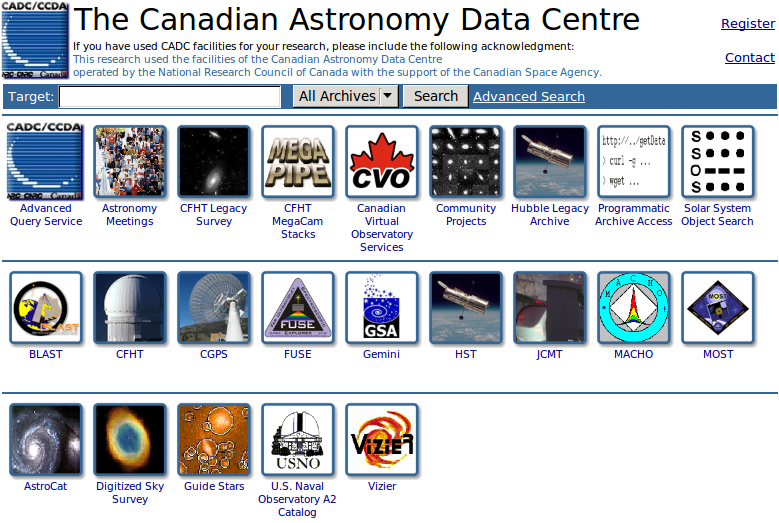
  Q:  In how many wavelength regimes can you access data on
      the galaxy NGC 4125?
Dealing with raw images or spectra can take a lot of time (and requires some knowledge of the instrument and detector). It's a lot easier to use information that someone else has extracted from the data. Fortunately, there are a myriad catalogs chock full o' astronomical information just waiting for you to query them.
My top choices for one-stop catalog shopping are
Both sites are gateways to very large collections of information. I tend to use Vizier more frequently, so I'll make use of it in the following example.
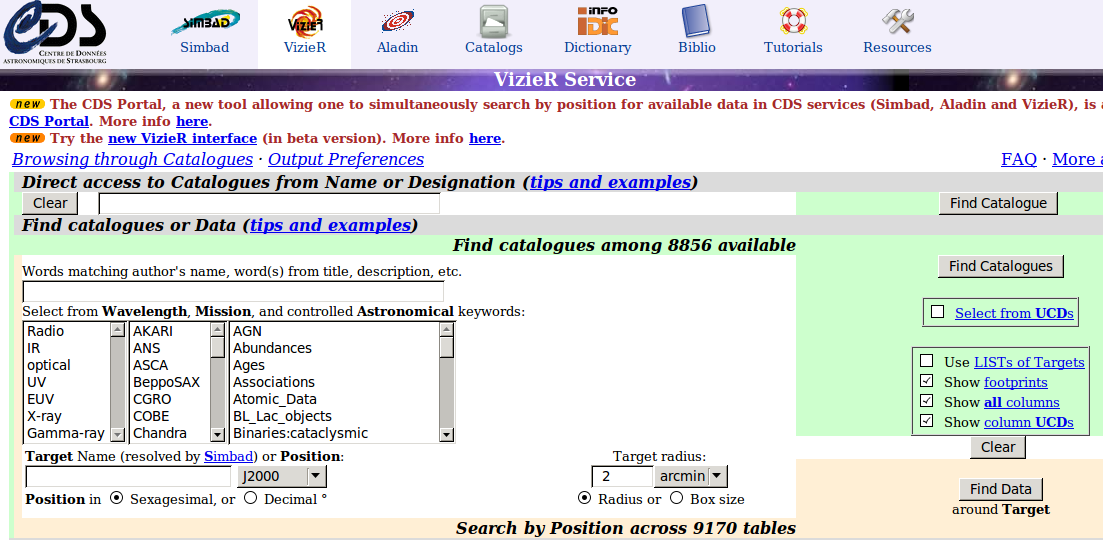
One of the neat feasures of Vizier is that, once you have found a catalog, you can very quickly select just the objects of interest by placing constraints on any of the fields within the catalog.
  Q:  How many items in the SDSS quasar catalog (16th edition)
      are closer than redshift z = 0.15?

      Is there any relationship between r-band magnitude and
      redshift?  Check by making a quick graph of these
      two quantities.
Does your plot look like mine?
When one is planning an observing run, it's very useful to have pictures showing the targets and nearby objects, so that one can verify that the telescope is pointing in the right position before taking a three-hour long exposure. Finding charts are also useful when one is trying to describe one's work to someone else. Many figures in published articles are simply annotated versions of finding charts, like this one:
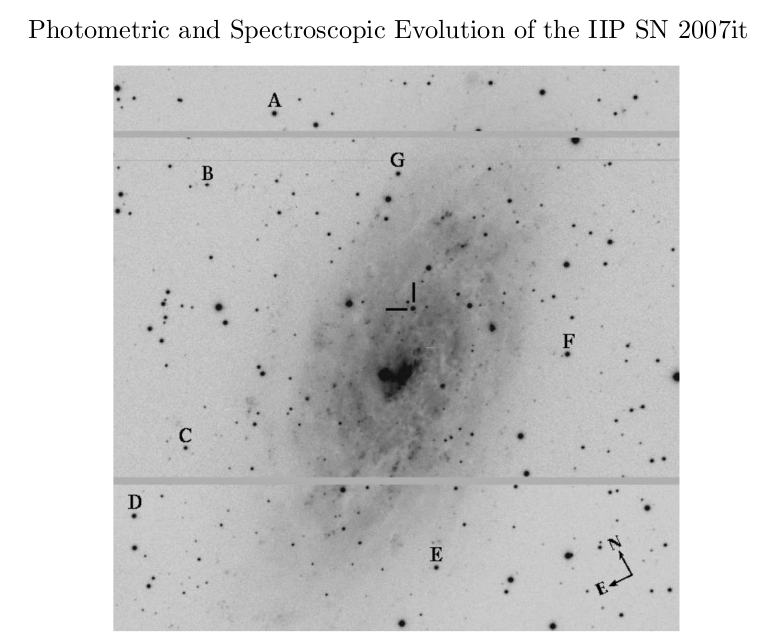
This is Figure 1 from
Andrews et al., ApJ accepted
My favorite tool for making charts is the
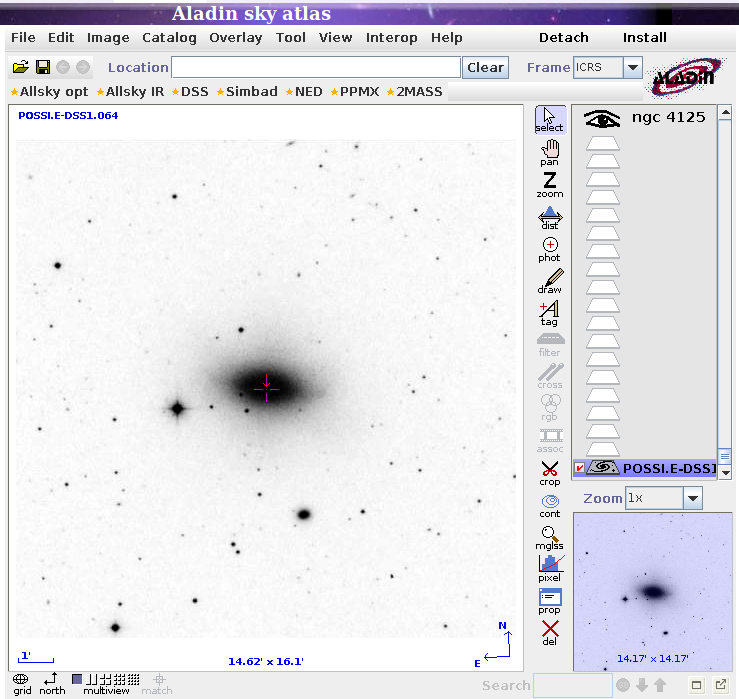
Aladin will let you to choose a background image(s) from just about any large survey or wavelength range, then allow you to place overlays showing the location of objects from any of the catalogs in SIMBAD. You can modify the image in simple ways, add labels, even create false-color composite images.
   Q:  How many QSOs lie within one degree of NGC 4125?


       Are those QSOs located in any special orientation --
       say, lined up with the major or minor axes of
       the galaxy?
Sometimes, there's no way to avoid it: you need to extract some information from an image. Let's assume that the image has already been cleaned; this isn't the place for a discussion of how one removes instrumental signatures from raw data. The question is -- how can you get the information you need from the image?
Well, in some cases, displaying the picture may be all you need to do. In that case, you can try
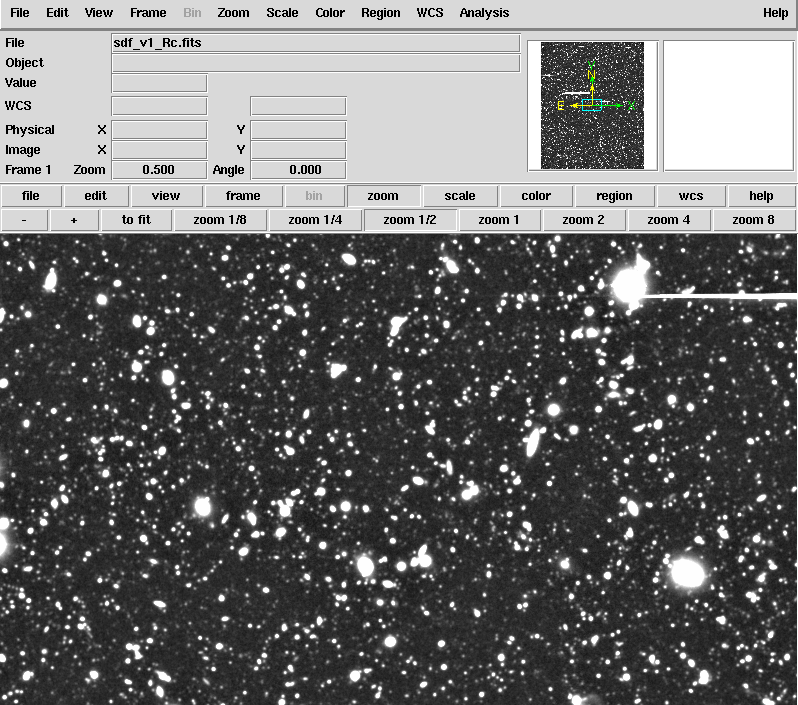
DS9 can create three-color composite images from images taken in different filters, create contour overlays, and select items from FITS event files. If you're looking for some difference between images taken at different times, DS9 can blink the images for you.
Unfortunately, if you want to more than VERY simply analysis, you'll need to find another tool. By itself, DS9 will tell you only the location and value of each pixel. It would be pretty tedious to add up all the light for even one object by writing down the values for all its pixels ....
  Exercise: Look at the image below, which covers a region
            roughly 20 x 20 arcminutes at

                 RA = 11:14:54.07   Dec = +29:35:06.0

            This image was taken on March 4, 2013, using
            the WIYN 0.9-m telescope at Kitt Peak.

               Download the FITS image

            Can you find the supernova?

              (Hint 1: it's not visible in earlier images of this region)
              (Hint 2: it's close to a faint galaxy)


            Can you estimate the magnitude of the supernova?
If you need to do some real image analysis, there are several packages specifically designed for astronomical observations.
Q: What do the people in this room use for image analysis?
There are many situations in which you may acquire some large dataset in the form of a big, ugly table.
For example, suppose that we use the
to ask for a list of all the stars within 20 arcminutes of the open cluster M67 which have magnitude brighter than 16.
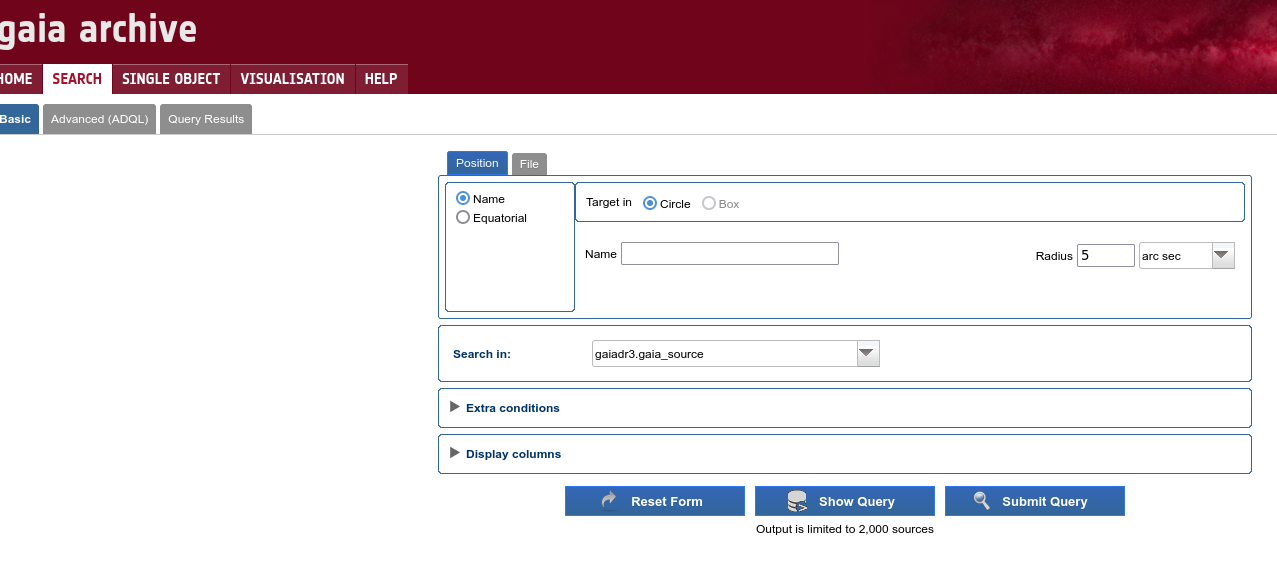
   Q:  How many stars are there?


   Q:  If you download the results, what format are they?
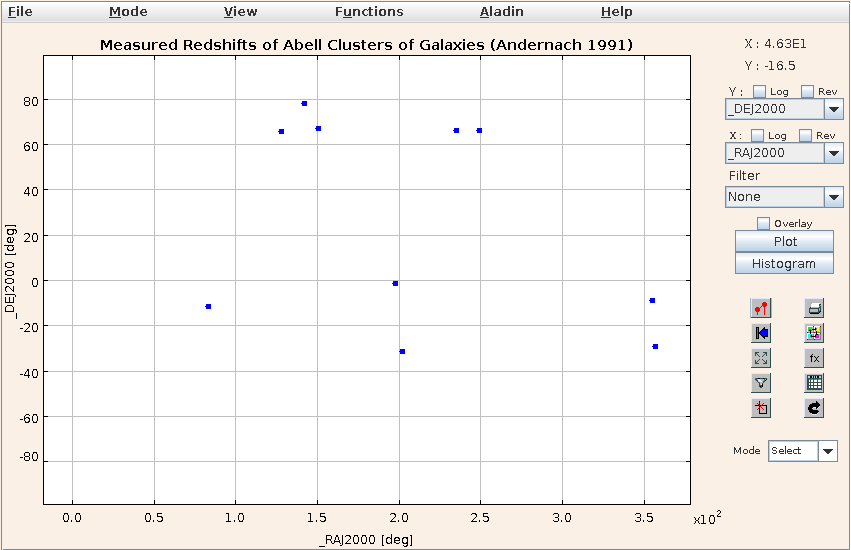
One very nice tool for dealing with big, ugly datasets is TOPCAT.
There are a number of ways to install TOPCAT on your computer. Once you do, just point it to the big, ugly datafile, and let TOPCAT do the work for you.
A graph can convey the important information of an entire paper in a single glance ...
As you can see, back in the Bad Old Days, scientists would create figures by hand.
A good hand-made graph is still perfectly acceptable, but these days, we can use computers to make graphs quickly and cleanly. I expect all students in this class to be able to make graphs in order to answer homework questions or extra credit projects. My favorite graphing software is
but there are many others.
Please pick some package and learn how to use it! I will deduct points on your submitted work if your graphs do not meet professional standards.
Q: What do the people in this room use for making graphs?
Copyright © Michael Richmond.
This work is licensed under a Creative Commons License.