 Copyright © Michael Richmond.
This work is licensed under a Creative Commons License.
Copyright © Michael Richmond.
This work is licensed under a Creative Commons License.
On March 6, 2009, NASA launched the Kepler satellite which is designed to find hundreds of planets around other stars (in addition to a good deal of other science). How will it look for those planets? Just what is inside the Kepler mission? And what has it found so far?
Let's find out. We'll start at the beginning....
The transit method is pretty easy to explain: if a planet's orbit around its star happens to cause the planet to pass in front of the star from our point of view, then the planet will block a little bit of the Sun's light for a brief time -- a few hours to a day or so.
![]()
Thanks to Ron Markham
for the animation.
Of course, this only works if the orbital plane of the planet is tilted just right. It's also a somewhat delicate measurement to make, since most planets are so much smaller than their stars that the dip in brightness is almost always less than one percent. See for yourself in this picture of a genuine transit, as Venus passes in front of our Sun.
![]()
Credit: David Cortner
However, if one makes careful measurements and uses the right sort of analysis, one can detect these little dips with relatively small telescopes. The first transit was measured by this little telescope:
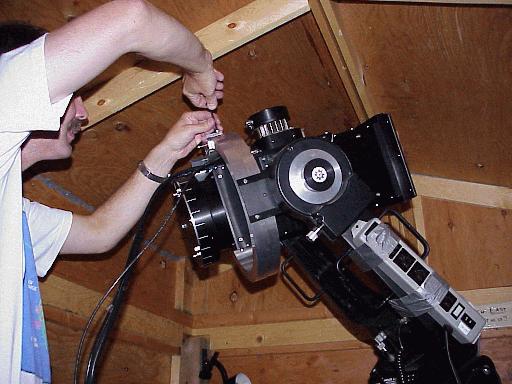
Here in Rochester, the RIT Observatory's 12-inch telescope and SBIG ST-8E CCD camera acquired this light curve of the system called TrES-3
How big is the telescope in Kepler? (Ouch, that sounds rather painful. Let me try writing that again)
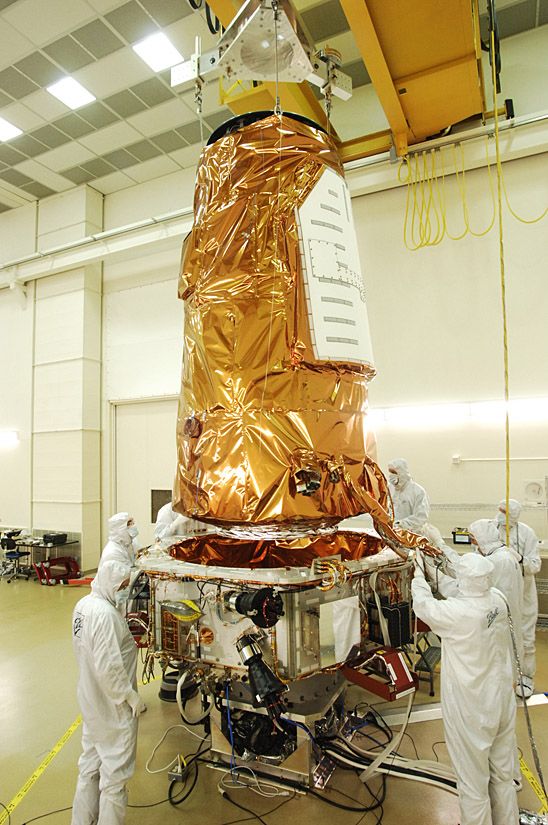
How big is the telescope inside the Kepler satellite? Pretty big: the primary mirror is 1.4 meters in diameter, but it sits behind a clear aperture of only 0.95 meters. So Kepler's aperture is smaller than that of HST, but much larger than those in the telescopes in the MOST (15 cm) or COROT (30 cm) satellites.

The telescope sits inside a satellite which is the size of a schoolbus.
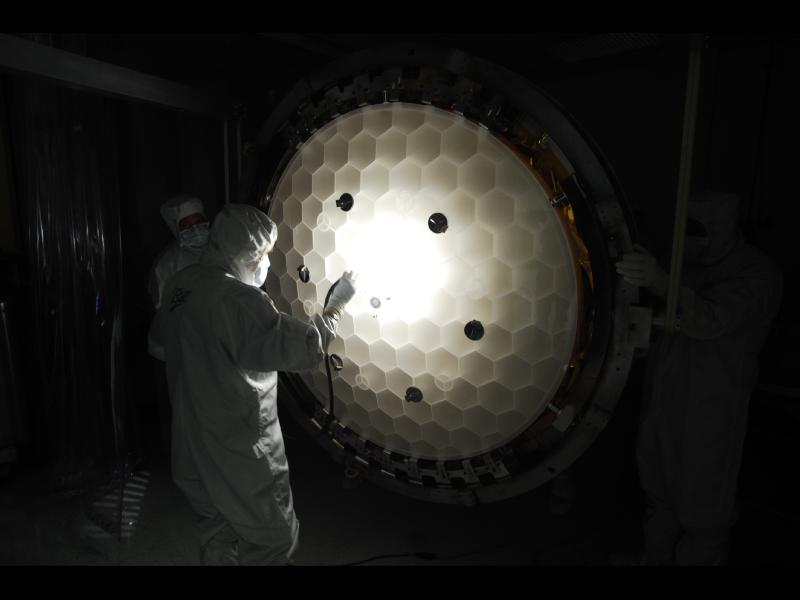
Notice the curvature in the focal plane. Kepler is designed to cover a wide field -- about 16 degrees in diameter -- and in order to keep the images sharp near the edges, one has to move the detectors to follow the curvature.
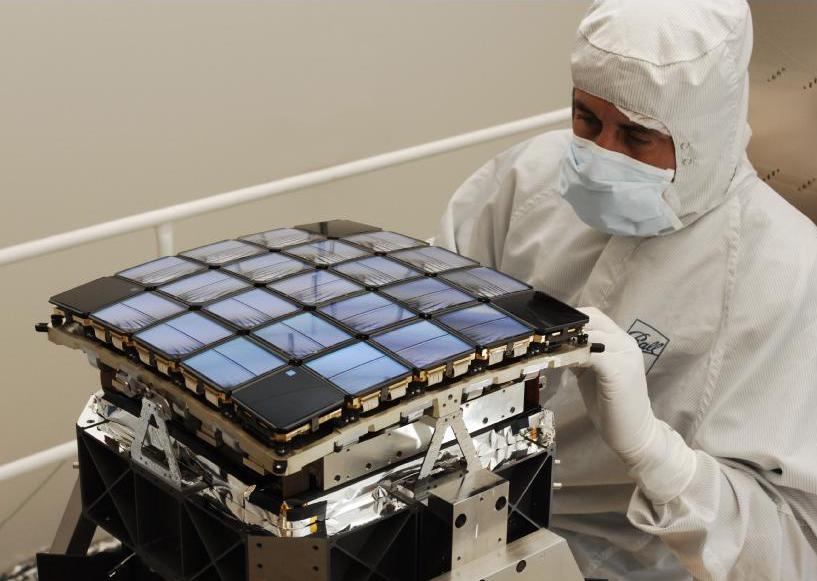
That looks like a lot of detectors .... and it is. In fact, there are
        42 CCD chips, each of which is
            50mm x 25mm
            2200 x 1024 pixels

        Can you guess how much memory it would take
        to store a single "image" from this camera?


        Answer: 42 chips * (2200x1024 pixels/chip)
                         * (2 bytes per pixel)

                 =  190 MegaBytes
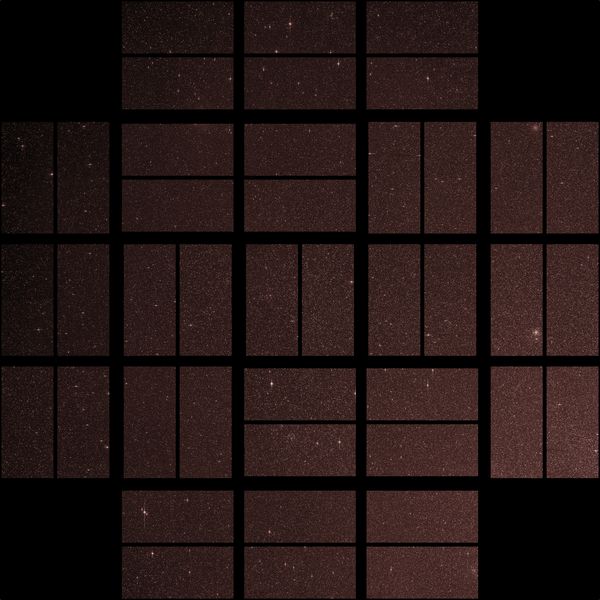
Each of the shiny square regions in the picture above is actually 2 CCD chips. You can count them more easily in this picture, which is one of the first-light images returned from the spacecraft in April, 2009.
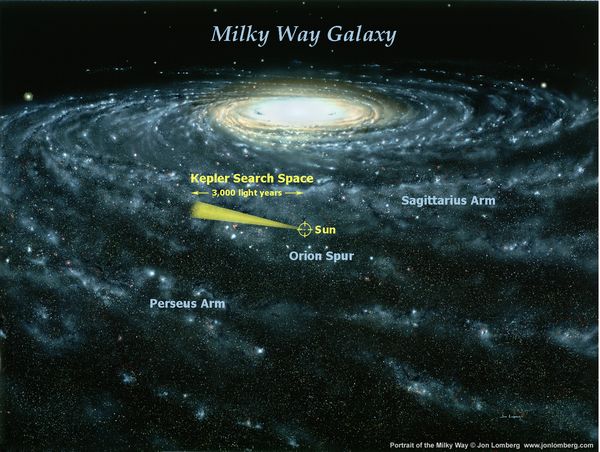
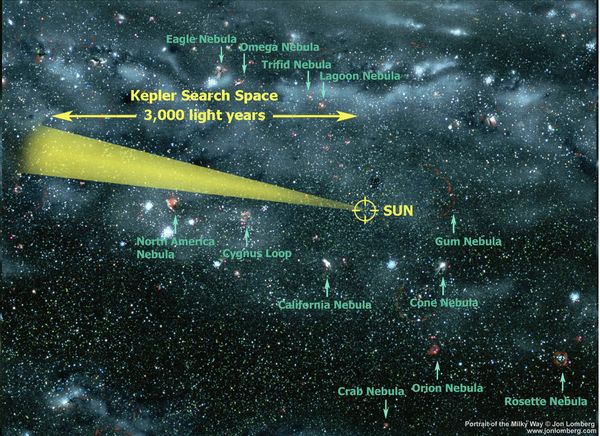
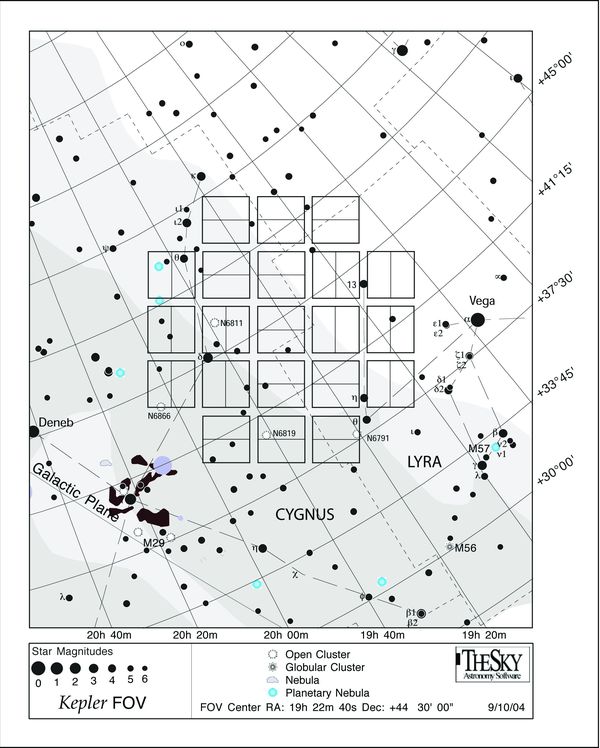
After doing the math, the planners have chosen a field in the Milky Way between Cygnus and Lyra. The field is centered at RA = 19:22:40 and Dec = +44:30:00, about 15 degrees away from the plane of the Milky Way. Only a single star brighter than sixth magnitude lies in this region, and only 12 stars brighter than sixth magnitude, so little of the detectors' area will be lost to bleed trails and saturation. In this region, a star like the Sun would reach V=12 at a distance of 270 pc, and it is possible (as we will see below) that Kepler might detect planets as small as the Earth around stars at or a bit beyond this distance. There are many tens of thousands of stars which lie within the dynamic range of Kepler: from V=7 to V=17.
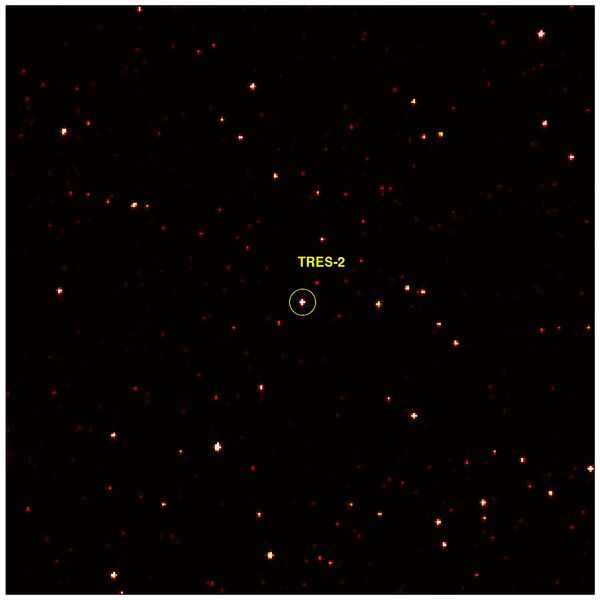
Note that Kepler's spatial resolution is not very fine: each pixel spans about 4 arcseconds. You can see the blockiness in this picture of the star TrES-2 . In addition, the telescope's focus is set so that stars are slightly out-of-focus, which spreads their light out across more pixels and helps prevent saturation.
However, the Kepler team has determined that even if a star saturates a CCD detector, they can still measure its brightness precisely. Stars which are up to 50 times brighter than the saturation point will cause charge to flow into neighboring pixels, but in a repeatable manner. The pipeline used to measure stellar brightness can handle these heavily-saturated stars under most conditions, allowing Kepler to study stars as bright as seventh magnitude.
In ordinary operation, Kepler looks at the same field over and over and over and over many times; the length of the mission is planned to be at least 3.5 years. The camera takes exposures in the following manner:
What's with the "groups"? Well, here's the problem: each individual exposure contains about 190 Megabytes of raw data, over just 6 seconds. If the satellite tried to transmit all that raw data back to Earth before the next picture was taken, it would to transmit at a rate of about 32 MBytes per second, to a ground station which was always listening. Alas, the actual performance of the transmitter is only about 0.5 MBytes per second (in the Ka band), AND the ground station only listens once a month. So, there's no way for Kepler to send us all its raw data.
Therefore, scientists have studied the field of view in advance and made a catalog of the stars which can be measured precisely and which are likely to be of interest. The astronomers on the team can choose two sets of stars:
In this way, the spacecraft can store the pixel-by-pixel data of a set of selected stars and discard the full-sized raw images. Only the data for the selected regions needs to be transmitted, and that's a tiny, tiny fraction of the volume of the raw data.
Very, very precisely. Much more precisely than any instrument can do from the ground, and (I think) more precisely than any of the existing space satellites, though MOST might give it a run for its money.
The first results from Kepler were announced at the recent AAS meeting in January, 2010. Here are some light curves from some of the brightest stars in the field. The units of time (horizontal axis) are days, and the units of flux (vertical axis) are parts per million.
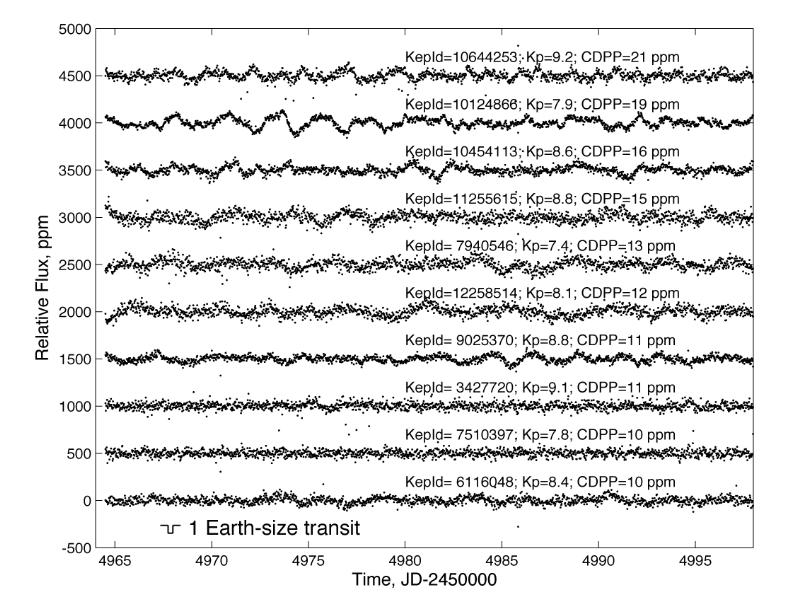
For comparison, here's what the light curve of a constant star measured by one of the best ground-based telescopes might look like: it has a scatter of only 0.1 percent = 0.001 magnitude. I've only reached about 0.003 magnitudes at best, myself.
Another way to grasp the quality of these measurements is to look at a graph of the scatter in the light curves as a function of stellar brightness. These light curves are derived from the "long cadence" sample, so they represent measurements every 30 minutes. We expect the bright stars to have less scatter, and indeed they do. Note that stars as faint as magnitude 12 have a scatter around 100 parts per million = 0.01 percent = 0.0001 magnitude.
Yes, it has. They aren't the planets that many people are hoping to find -- Earth-sized planets orbiting at Earth-like distances from their hosts -- but there's a reason for that. Let's look at the discoveries first.
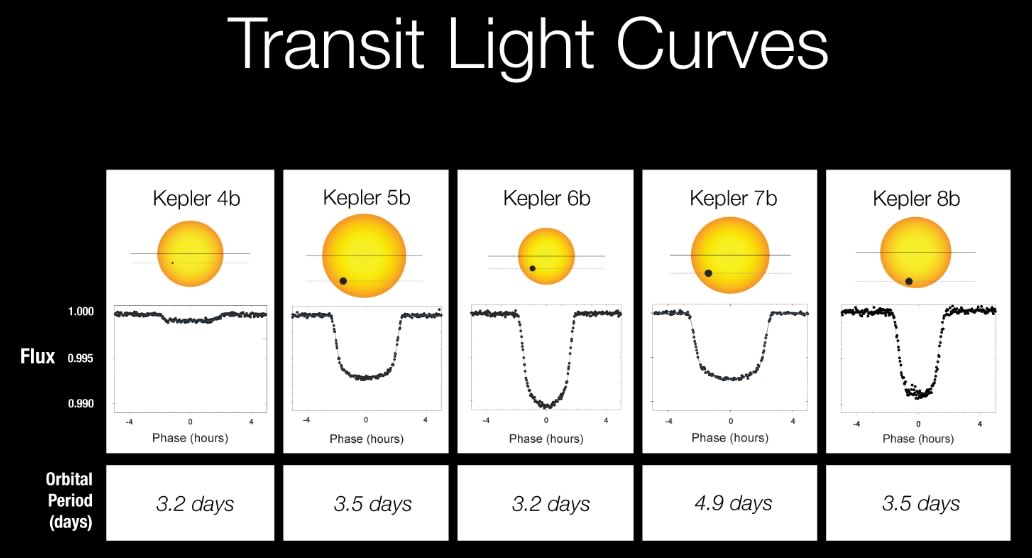
At the time of writing (Feb 5, 2010), the Kepler team has announced the discovery of five planets which were previously unknown to astronomers on Earth. Here are their light curves:
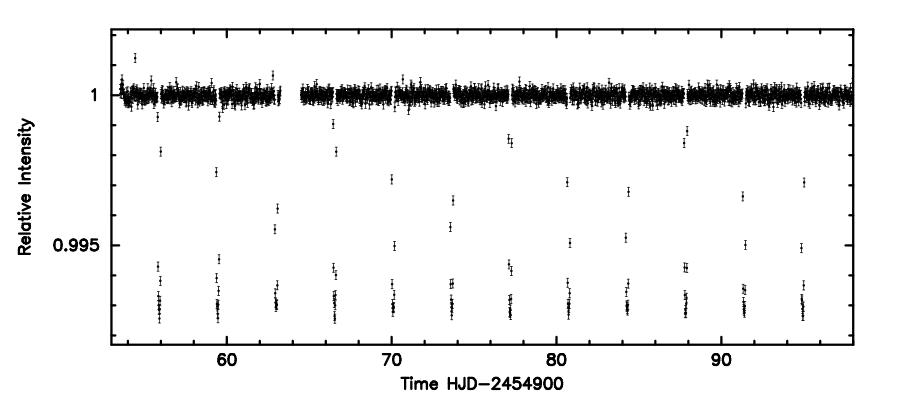
Let's look at one of them in more detail. Here is the "raw" light curve for Kepler 5 over about two months:
If you determine the period of the planet's orbit and replot the measurements as a function of orbital phase, you can see the dip due to the transit very clearly:
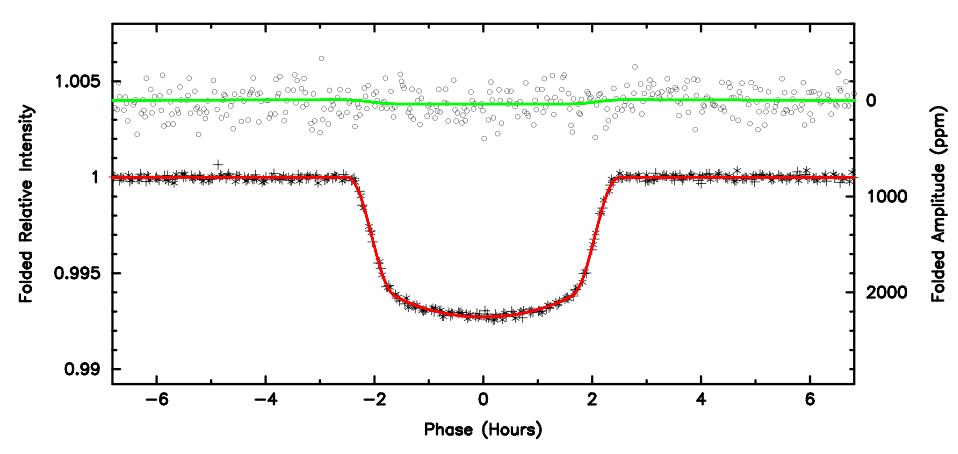
The lower, red curve shows the dip when the planet moves in front of the star and blocks some of the star's light. The upper, green curve (with a vertical scale expanded by a factor of 5 -- see right-hand axis) shows the position at which a dip WOULD occur when the star moves in front of the planet, blocking the light reflected towards us from the planet.
    Do YOU think that Kepler detected
    a dip during the occultation of
    the planet by its star?
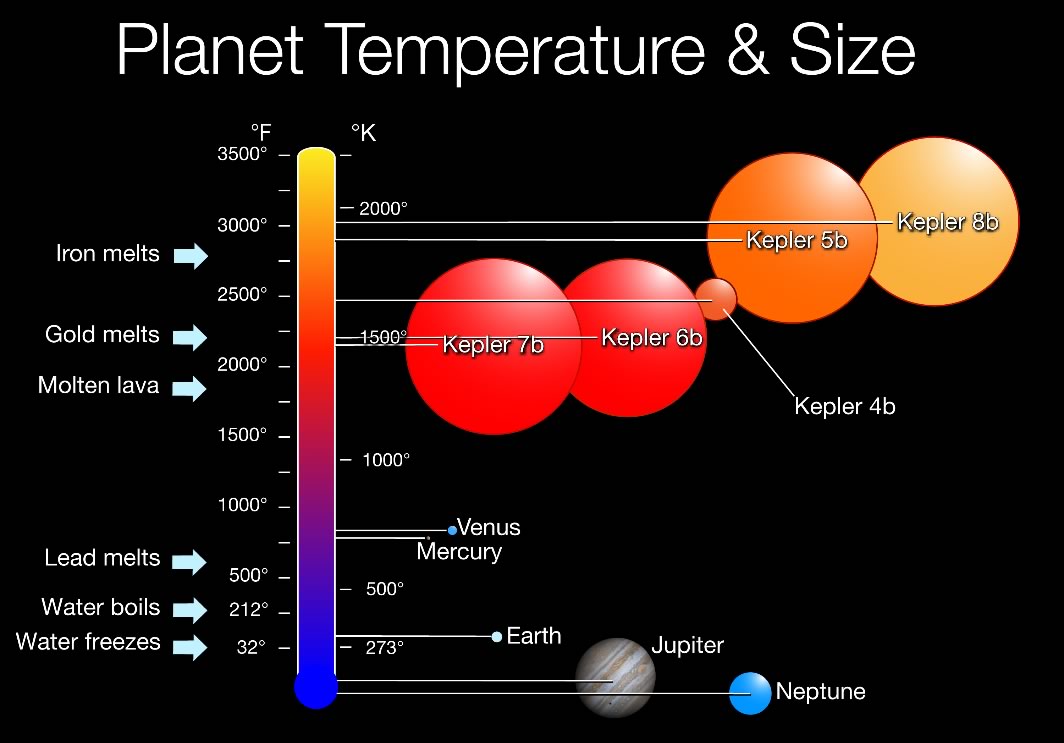
Why did I say that these planets might not be very interesting, at least to some people? Well, it's because they are
TOO BIG
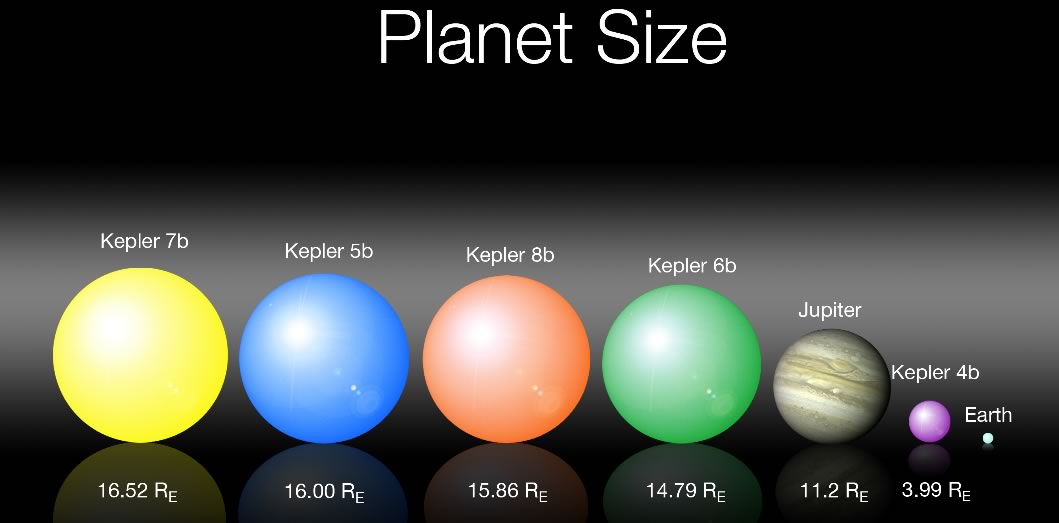
and
TOO HOT
There's a reason that the first planets to be announced are both big and hot. Two reasons, in fact.
As time goes on, the Kepler team will be able to detect planets which have longer and longer orbital periods -- which means they orbit at larger and larger distances from their stars. It will also be possible for the team to apply optimized techniques to measure the light from their stars of interest, which will lead to the detection of smaller and smaller planets. The hope is that before the end of its 3.5-year mission, Kepler might be able to detect some planets which have orbits of about 1 year in length -- meaning planets which might be at roughly Earth-like distances from their hosts.
I've only touched on a very few of the neat tricks the Kepler team has devised to make the best use of their satellite. I urge you to read some of the technical papers on the Kepler web site, so you can learn much more about this mission.
For example, in addition to measuring the brightness of stars, Kepler also measures their positions with great precision. Each 30-minute measurement of a bright star can yield a position with a precision of about 4 milliarcseconds. Over the course of 3.5 years, these astrometric measurements will allow astronomers to determine the parallaxes and proper motions of tens of thousands of stars.
Kepler will monitor several thousand stars in "short cadence" mode in order to look for stellar oscillations, similar to the ones we can see in the Sun. The oscillations can provide information on the chemical and physical properties of the interiors of these stars, which would greatly increase our knowledge of stellar structure.
Copyright © Michael Richmond.
This work is licensed under a Creative Commons License.