Contents
During the summer of 2015, I spent about a month in Japan, working with astronomers at the University of Tokyo's Institute of Astronomy thanks to the generous support of a fellowship from the Japan Society for the Promotion of Science. With the help of my colleagues, I was able to make some small progress in the study of a set of images taken with the Subaru Telescope. There are no final results to report -- not really any intermediate results, really -- but I thought this little account might give some current students an idea of how some scientific research actually happens.
As the title notes, there were times when I thought that things were going really well ... and other times when I realized that maybe things weren't so great. That's just the way it goes when you are investigating and asking questions.
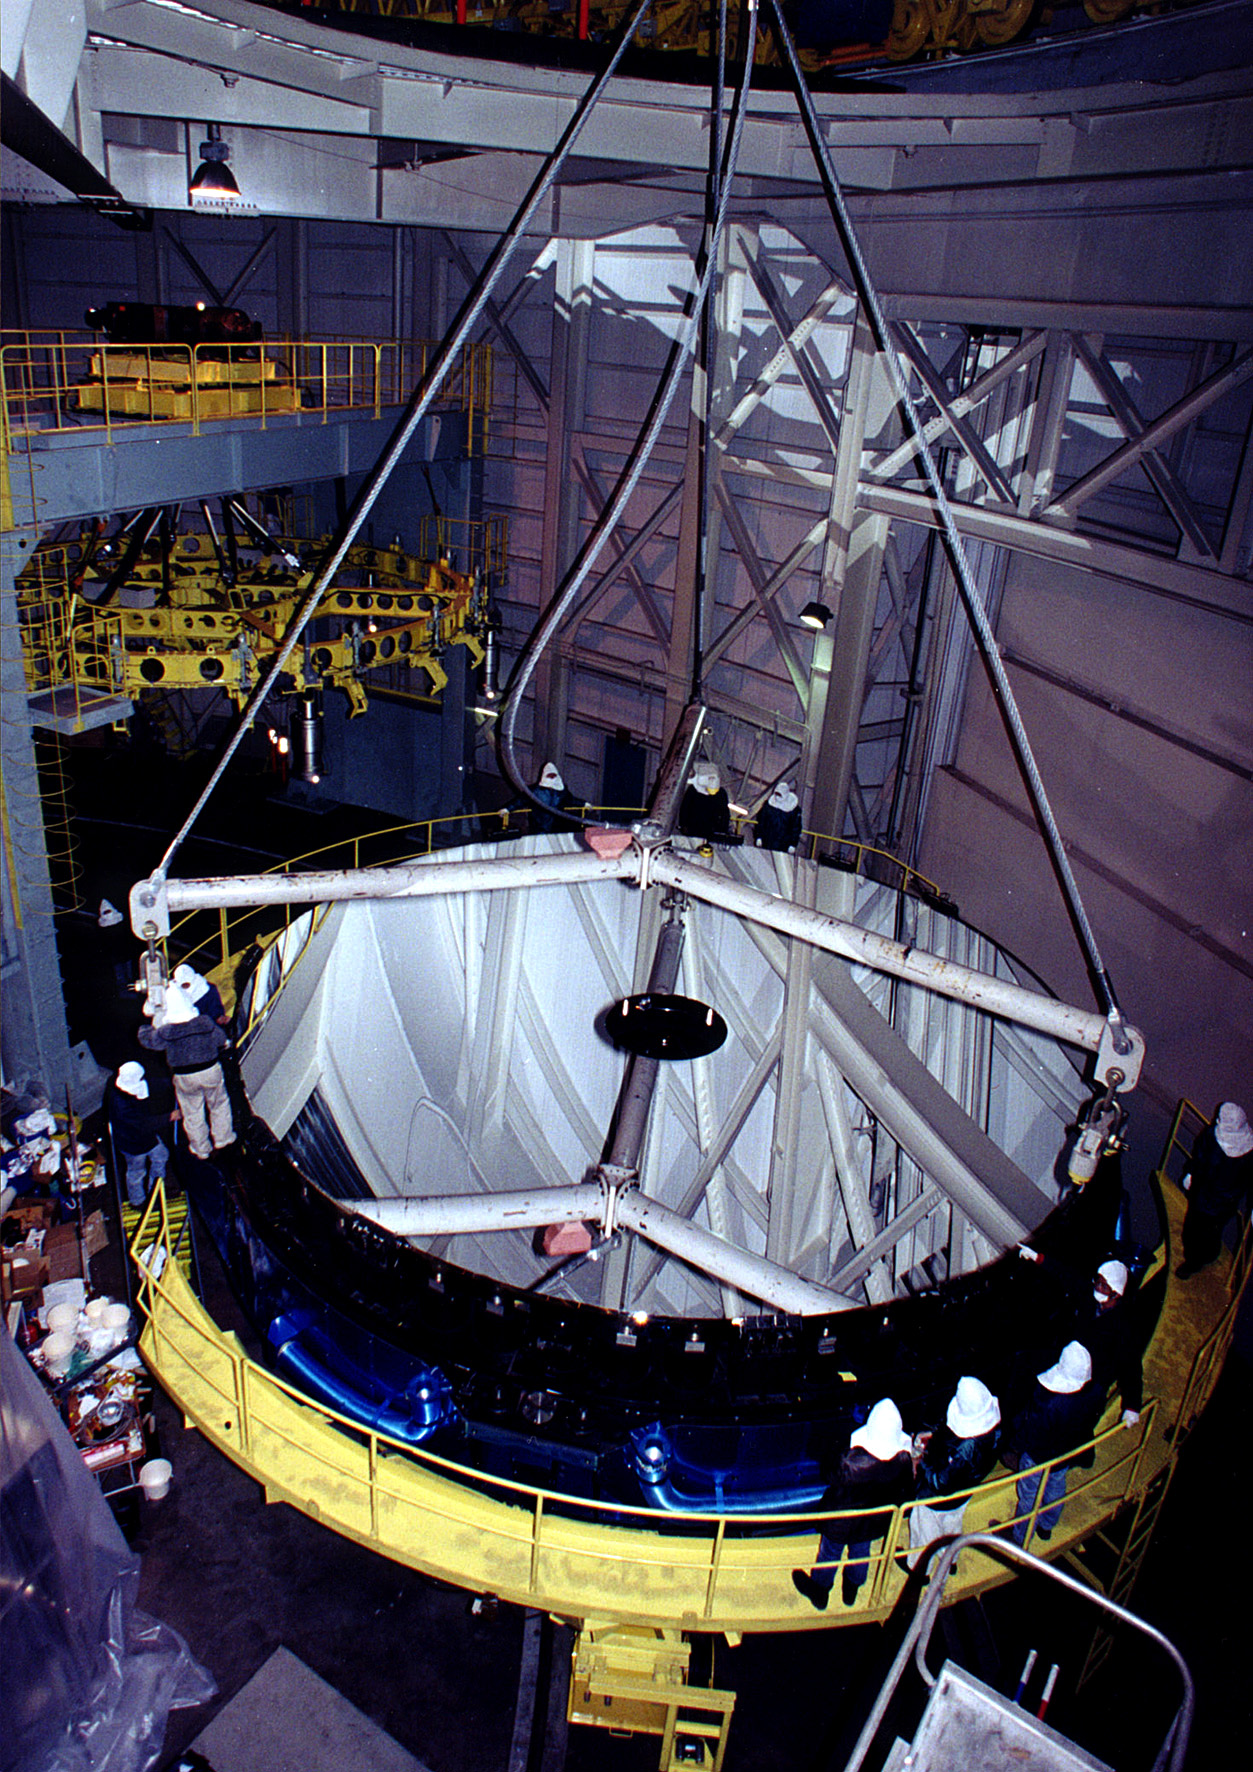
The dataset I am studying starts with the Subaru Telescope , a behemoth with one of the largest monolithic mirrors in the world: 8.2 meters in diameter.
The telescope sits atop Mauna Kea, about 14,000 feet above sea level. In order to take advantage of the excellent seeing, Japanese astronomers have constructed a series of ever-improving CCD cameras.
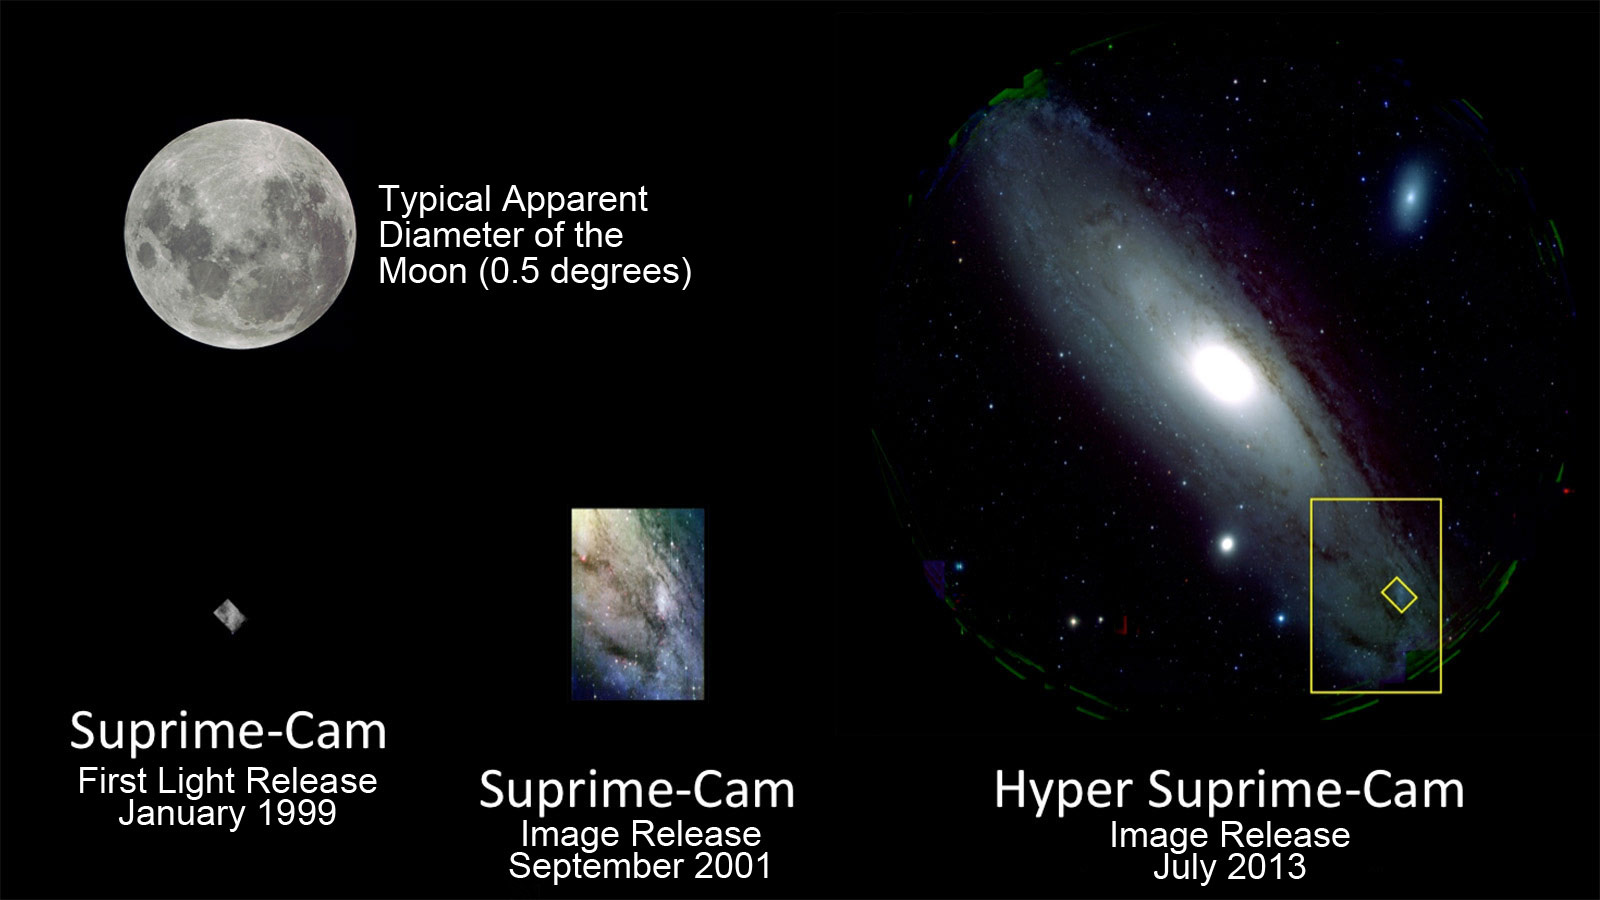
The most recent version, called "Hyper Suprime-Cam", is a very complex instrument. It begins with a honking big set of optics to create a distortion-free image over a very wide area.
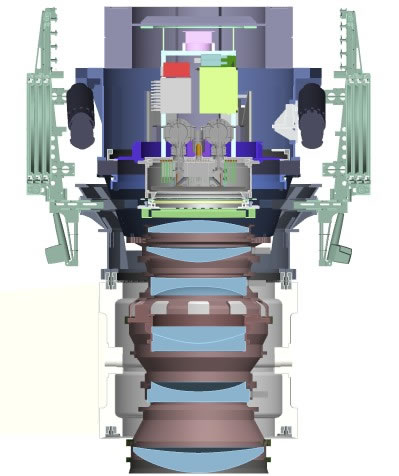
Image courtesy of
NAOJ
How big is "honking big?"
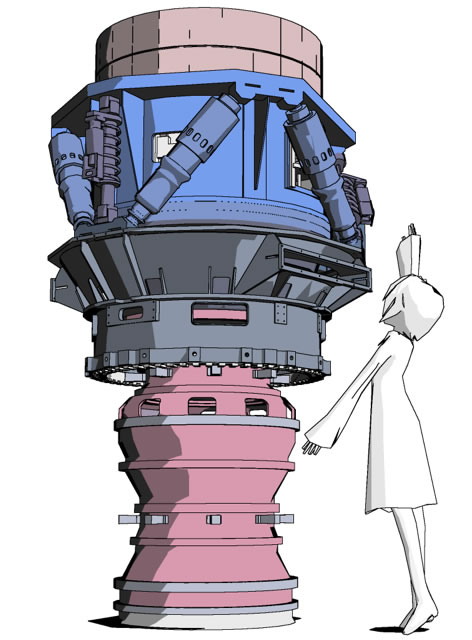
Image courtesy of
NAOJ
The camera structure has a mass of (something like) two tons. Oh, and it has to sit up here, suspended in space at the top of a telescope which slews across the sky.
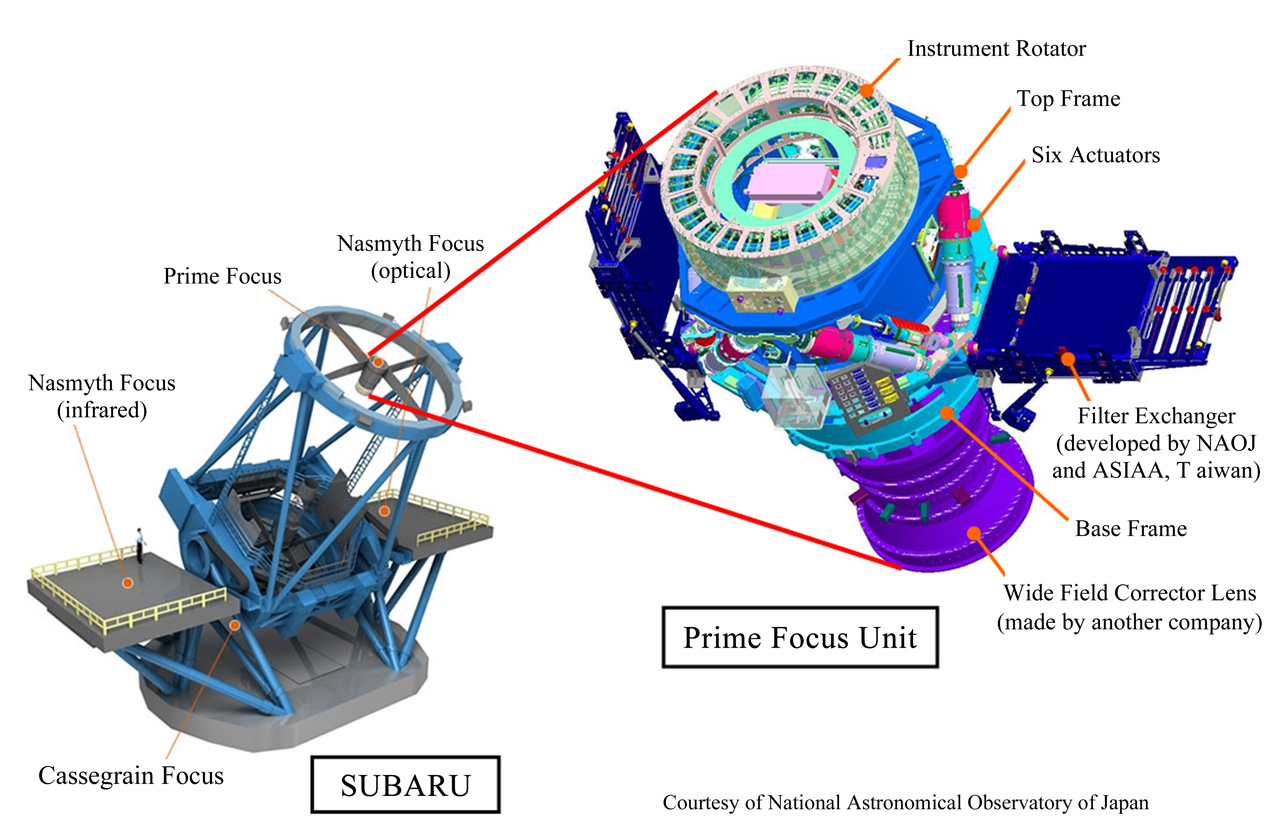
Image courtesy of Mitsubishi Electronics , who made the actuators controlling
the Prime Focus Unit
The focal plane of this camera is tiled with CCDs:
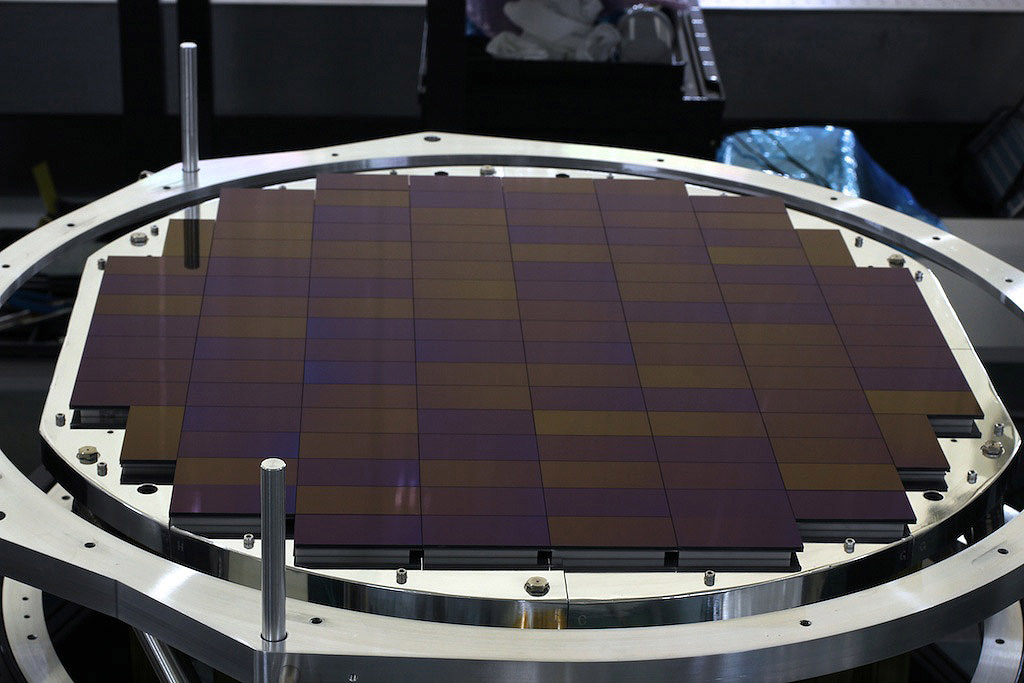
The result is a field of view about 1.5 degrees in diameter, filled with pixels about 0.17 arcseconds on a side -- to take advantage of the excellent seeing at the site. That's a LOT of data. A single snapshot creates an image with (very roughly) 790 million pixels, which, at 2 bytes per pixel, requires roughly 1.6 GB of storage space.
One of the challenges of working with the HSC is dealing with the sheer volume of the data! One technique adopted by the Japanese astronomers is to combine several dithered images to fill in the gaps between CCDs, then break up the gigantic mosaic into "patches" or "tiles" of 4000 x 4000 pixels for convenience.
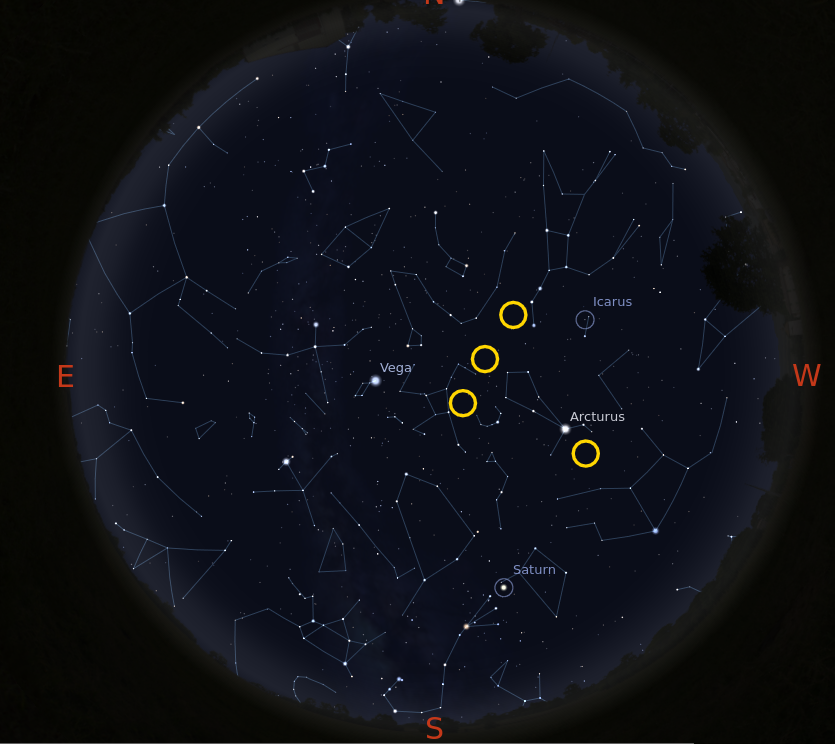
HSC is used for many different scientific projects, many involving very faint objects at high redshift. I was asked to look at one little subset of the data gathered in the course of one of these large surveys -- just a tiny piece of a much larger pie. I concentrated on 4 fields.
Other scientists had already done a LOT of work on the dataset (thank goodness -- this represents many months or years of work!)
To a large extent, my job was simply to look through the catalogs of objects with many, many measured properties. Easy, right?
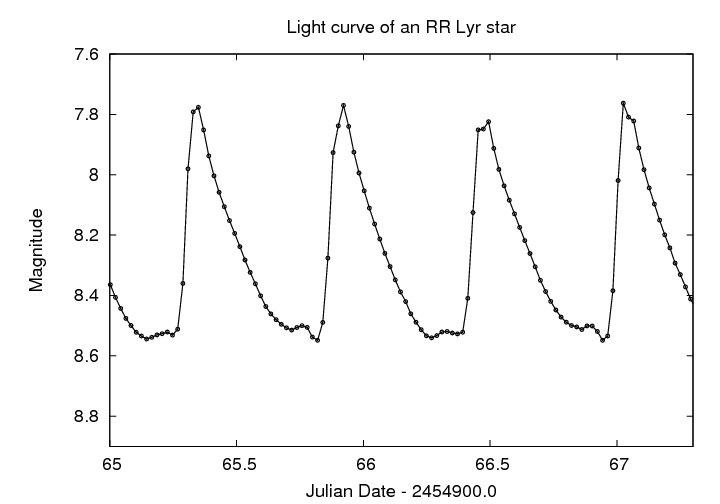
RR Lyr stars are very useful markers:
If we could find faint RR Lyr stars in these fields, we might be able to trace the halo population of the Milky Way.
How to find RR Lyr stars? I started with the catalogs, and tried to match up measurements of objects made at different times. Most stars will have the same magnitude, time after time -- but not variable stars. I used a technique called inhomogeneous ensemble photometry to make tiny adjustments for the image-to-image photometric offsets, and to figure out the typical scatter in the measurements of each star.
One way to show the result is a "sigma-vs-magnitude" diagram. Any variable sources will lie above the locus of ordinary stars. This was the diagram I saw for the first patch I checked -- the central patch in the Bootes field.
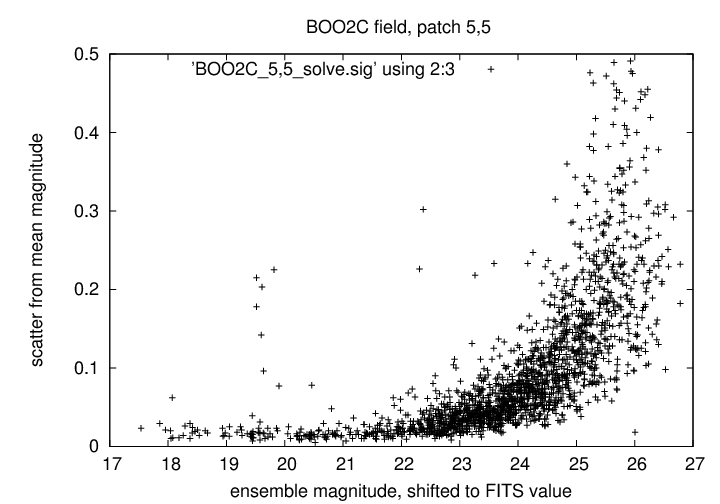
Do you see any outliers?
Why, yes -- there are several bright objects, roughly magnitude 20, which have a quite a large scatter. I chose one of them, "Star F", and plotted its light curve with a bunch of different trial periods close to half a day. A few minutes of trial-and-error gave me this rather nice light curve:
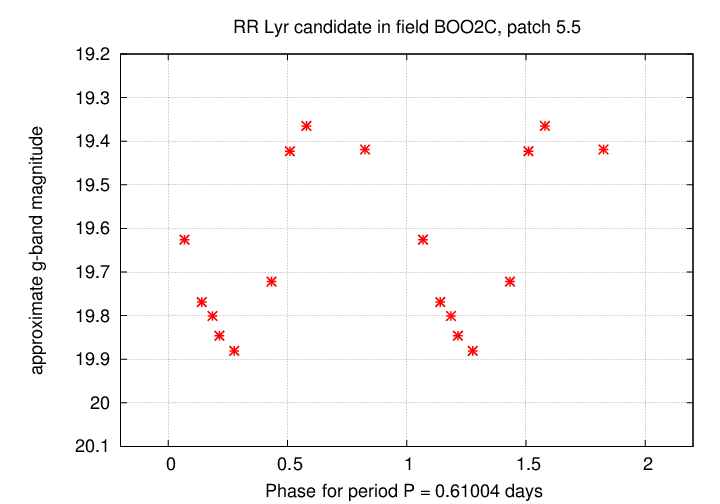
This was just three days after I started work on the project.
Status: Whoo-hoo!
And then ... I typed the coordinates of this star into SIMBAD.
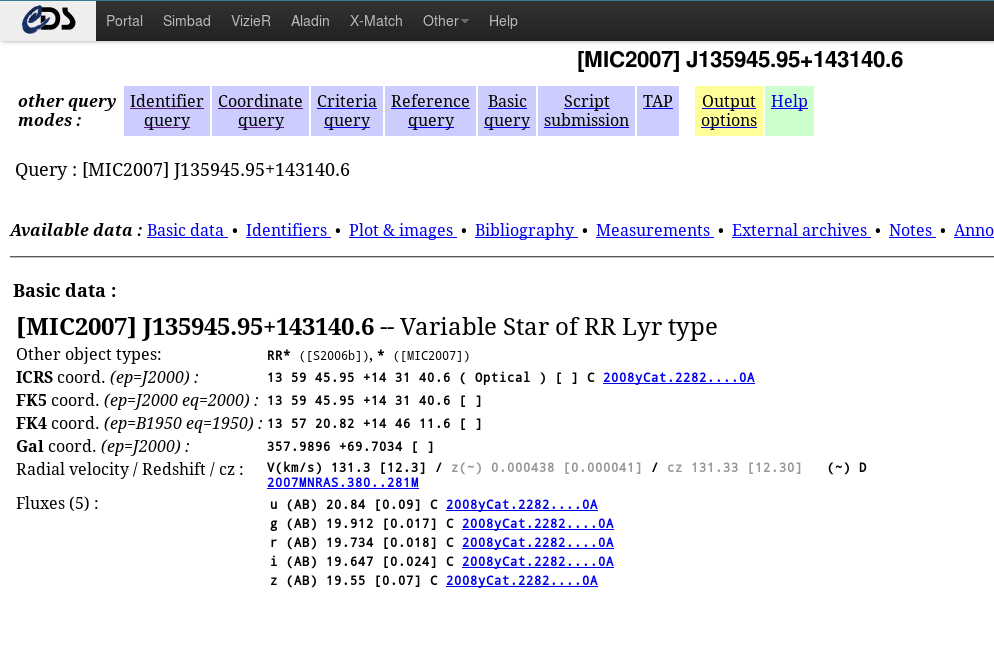
Oh. Someone else already found it. Rats.
Well, there are several other outliers. Some of them might be RR Lyr stars, too. I can still add some new data to help us understand the Milky Way.
Status: Rah
With some extra digging, I found several relevant papers, including
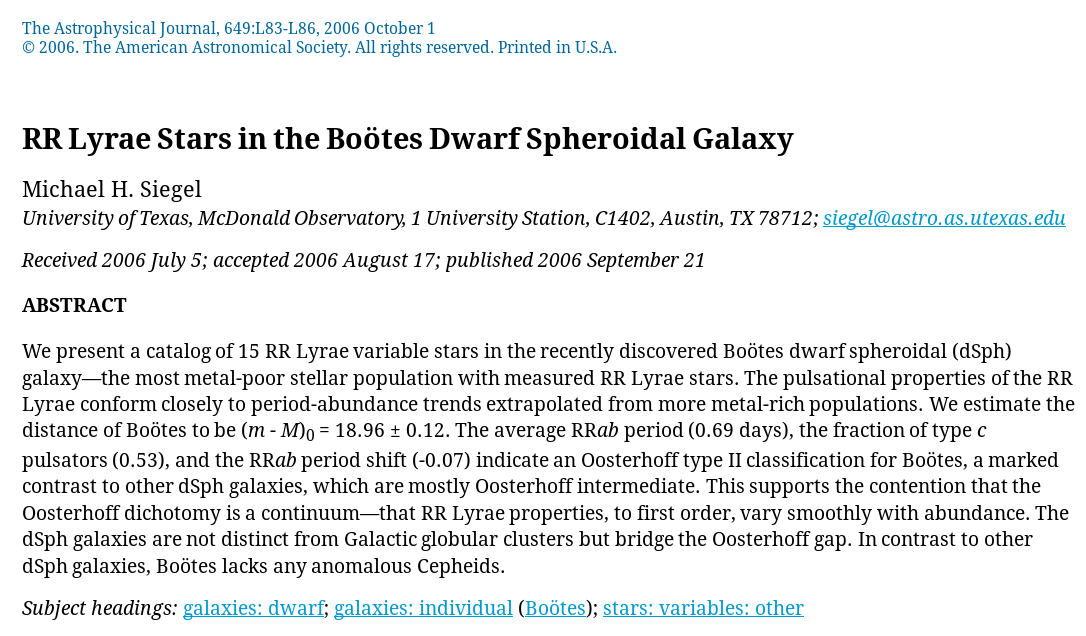
Ah. All these variables are RR Lyrae stars in a recently discovered dwarf spheroidal galaxy which orbits the Milky Way.
Status: Grumble
Well, this was just the beginning. This little satellite galaxy just happened to appear in the center of the first of 100 patches in the first of 4 fields. Ha-ha, what an (unfortunate) coincidence.
Surely, I thought to myself, when I search the other 99 patches in this field, and the hundreds of patches in the three other fields, I'll find many more RR Lyr, right?
So, I spent the next week looking through all the other patches in all four fields. I did find LOTS and LOTS of objects which appeared to vary by significant amounts. I also noticed some puzzling features in the number of objects found in each image: some images contained twice as many detected objects as others, even though the exposure times were the same.
    Q:  What could cause such a big variation
        in the number of objects detected in
        different images?
There are many possibilities, but in this particular case, the answer was mostly variations in seeing: some images were taken when the field was low in the sky, or when the winds increased.
I also discovered just how hard it is to try to determine if an object has a real periodic variation when one has only 10-12 measurements. Answer: wicked hard. I'd read that in order to have a good chance at detecting real periodic behavior, one ought to have around 30 or 40 measurements of a star .... and I can confirm that 10 is not enough.
Anyway, after trying to account for this and other effects, I concluded that I was unable find any other RR Lyr stars.
Status: Sigh
Now, to be fair, way back at the start of my visit, when I was discussing possible projects with my colleagues Mamoru Doi and Tomoki Morokuma, they explained that they had spent quite a bit of time estimating how many RR Lyr ought to be found in a search of these fields, based on the density of RR Lyr stars in space and the volume covered by the images. They told me that one might expect to find 0 or 1 RR Lyr in the dataset.
So, Mission Accomplished!
One of the currently hot topics in astronomy is the mystery of Fast Radio Bursts (FRBs): very short -- less than 1 second long -- bursts of radio waves detected by different radio telescopes over the past decade. I believe that most sources have only been detected once, making followup really, really hard.
Just what might be causing these bursts?
And might there be optical counterparts to the FRBs?
Now, the HSC dataset was certainly not designed to find such objects. Detailed calculations of the number of sources which one might expect to find in the total of 4 fields over 3 nights suggested that the number would be small -- probably 0, maybe 1. But, if one WERE found, the payoff would be huge. This is a classic case of a "high risk, high reward project".
Nota Bene: high-risk projects are not good choices for Ph.D. projects.
Fortunately, I already had a Ph.D., so it didn't matter if the project failed. Besides, the prospect of solving the mystery of an unknown class of astronomical sources was very appealing. Who knows -- the person to solve the puzzle might even become famous.
Status: Going for it
So, how does one find objects which only appear once? It sounds easy: look through catalogs created from individual images and eliminate objects which in more than one image. The leftover one-time-only-detections must be the sought-for FRB counterparts.
Right?
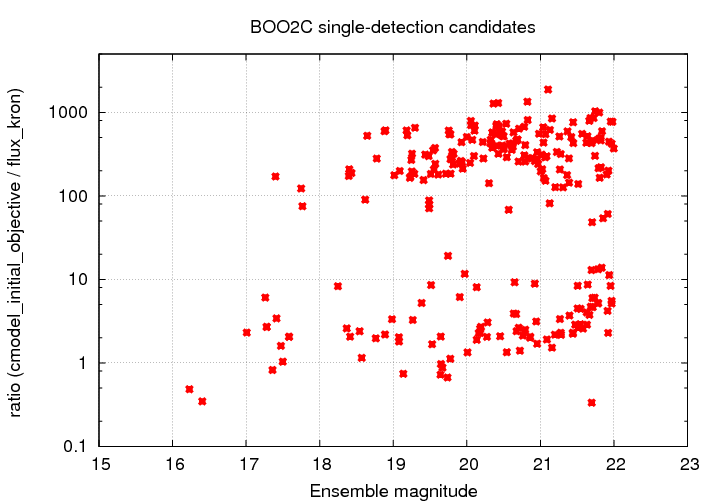
So, I made a sweep through the catalogs and picked out all the objects which only appeared once. There were ... quite a few. Note the logarithmic scale on the y-axis.
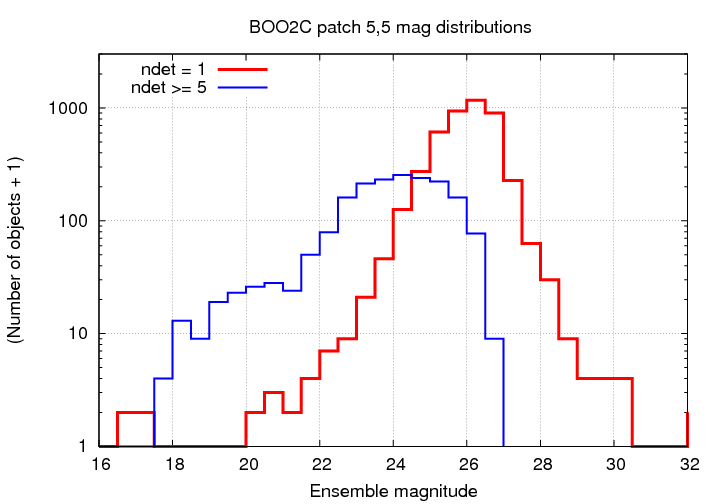
How could I cut down the candidates to a manageable size?
Okay, now the number of candidates in the Bootes field was smaller .. just about 200 over the entire set of patches. I decided to start "blinking" them: comparing an image with the candidate against an image of the same region taken at a different time.
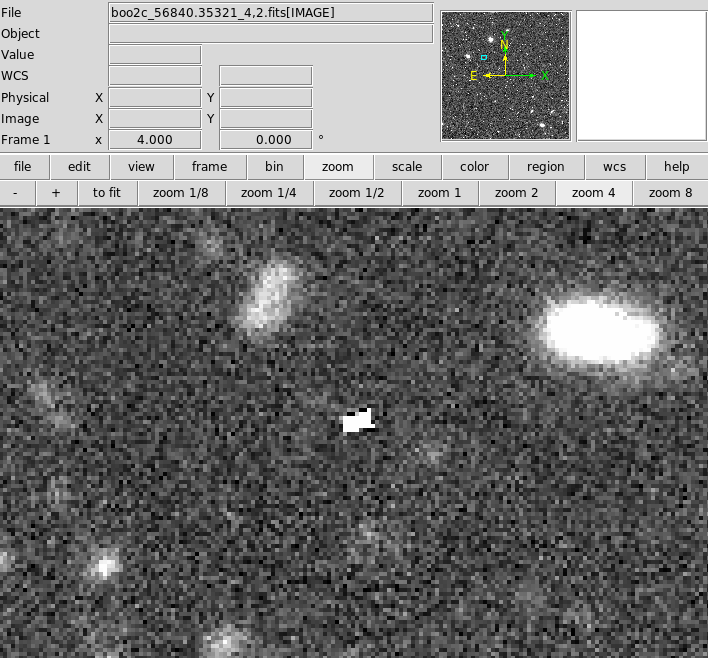
After a few hours, I figured out that many of these one-time-only candidates looked very similar. Promising at first:
but obviously not a real celestial source when one zoomed in:
I spent quite a bit of time trying to figure out if any of the roughly 100 measured parameters for each object could be used to distinguish these "defects" from real stars. Let me give thanks to the authors of
two packages which allow one to examine very quickly the properties of large FITS tables.
"Aha!", I said to myself, "the cmodel_initial_objective parameter looks very high for these defect-type objects." Good. I can get rid of them.
Status: Cautiously optimistic
That left only about 100 candidates in the Bootes field. I went back and blinked these good ones. Most were errors caused by objects found at the very edge of the field, or caused by big differences in seeing between one image and the next.
But there was one promising candidate: it was a nice, bright point source, and only appeared once in the catalogs.
mag = 21.74
When I compared this image to other images, I zoomed in on the candidate, and I didn't see any objects at its position. Excellent!
Status: Excited
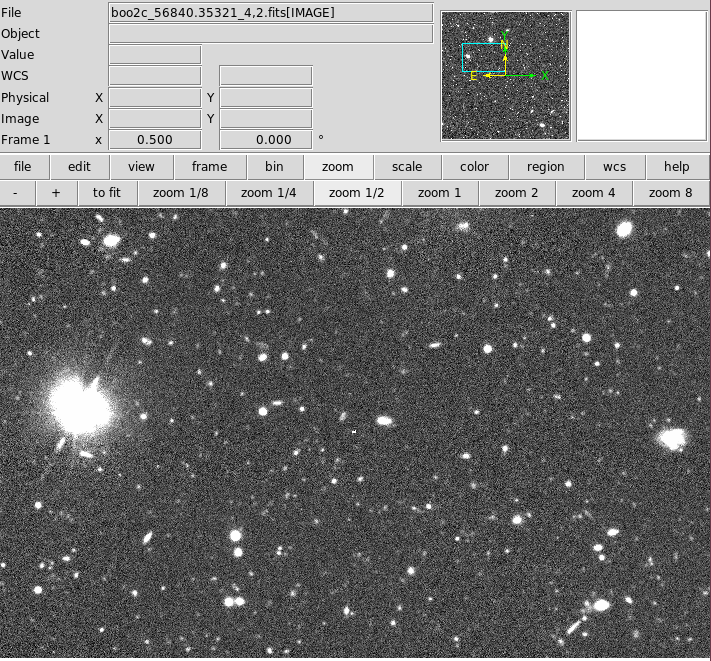
Eventually, I did the comparison with a wider field of view, and discovered something:

It moved. Argh.
Status: Frustrated
It's an asteroid. A strange one -- look at its appearance in the third image taken that night -- but an asteroid.
When I went back through my notes, I discovered something that might have saved me some time and effort earlier. Even though the eye notices the asteroid in all 4 images, the catalogs showed it as present only in 1 image. Why?
Well, in the third image, it's a double-point-source, so that disqualified it as a "star". Fine.
But what about the fourth image, for example; why wasn't the object detected in it?
Remember the magnitude of the object in its only detection? It was mag = 21.74. Well, in the fourth image, the object was just a bit fainter: mag = 22.04
Oops! This means that in the fourth image, the object fell just outside an arbitrary boundary I had set to simplify the process.