 Copyright © Michael Richmond.
This work is licensed under a Creative Commons License.
Copyright © Michael Richmond.
This work is licensed under a Creative Commons License.
There is more to the universe than meets the eye. Literally.
Our eyes are sensitive to visible light waves ... but they are just one little tiny bit of the entire electromagnetic spectrum. Light waves with energies both higher and lower than optical light do exist, and can tell us a great deal about objects in the universe -- much more than we can learn using optical light alone.
Astronomers started to investigate portions of the electromagnetic spectrum outside the optical in the 1930s. Advances in radar and rocket technology during World War II gave this new research a big push, and it has continued to grow ever since.
                Wavelength (m)        Frequency (Hz)          Energy (J)
-------------------------------------------------------------------------------
                             -1                    9                       -24
Radio                > 1 x 10              < 3 x 10                < 2 x 10

                  -3         -1          9         11          -24         -22
Microwave   1 x 10   - 1 x 10      3 x 10  - 3 x 10      2 x 10    - 2 x 10

                  -7         -3          11        14          -22         -19
Infrared    7 x 10   - 1 x 10      3 x 10  - 4 x 10      2 x 10    - 3 x 10

                  -7         -7          14        14          -19         -19
Optical     4 x 10   - 7 x 10      4 x 10  - 8 x 10      3 x 10    - 5 x 10

                  -8         -7          14        16         -19          -17
UV          1 x 10   - 4 x 10      8 x 10  - 3 x 10      5 x 10    - 2 x 10

                  -11        -8          16        19         -17          -14
X-ray       1 x 10   - 1 x 10      3 x 10  - 3 x 10      2 x 10    - 2 x 10

                            -11                    19                      -14
Gamma-ray            < 1 x 10              > 3 x 10                > 2 x 10
-------------------------------------------------------------------------------
In musical terms, the optical region corresponds to a single key on the keyboard of light:

It is thanks to the information transmitted to us across the universe by electromagnetic waves that we can write things such as:
   Some regions of space are filled with gas and dust.

   Individual atoms combined to form molecules such as
                  water (H2O), methane (CH4), ammonia (NH3),

   Most clouds in the space between the stars are pretty warm:
                  their temperatures are perhaps 50 to 100 Kelvin

   Stars in a globular cluster are moving with speeds
                  of about 7000 meters per second.
But how? How does light provide all this information?
You probably already know that hot objects glow with a color that depends on their temperature. Relatively cool lava -- only 1000 Kelvin -- appears a dull red:
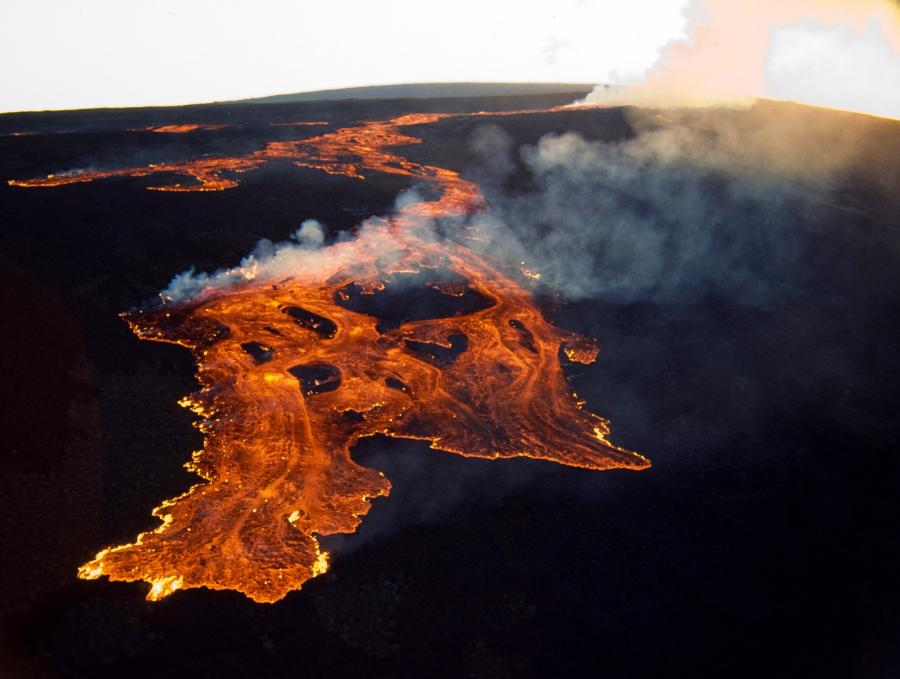
Image courtesy of
US Geological Survey
while a butane blowtorch at 3200 Kelvin emits bluish-white light:
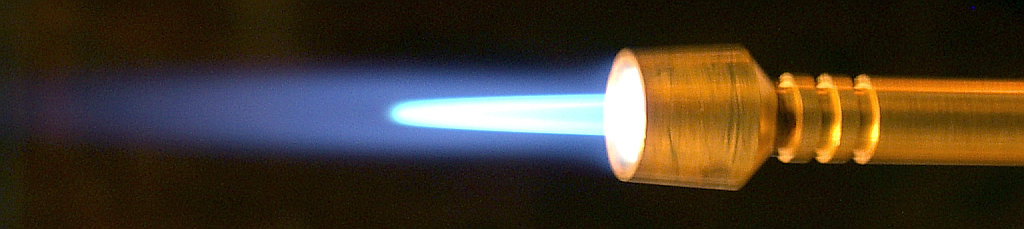
Image copyright
Rnbc , provided by Wikimedia
The same is true of stars: the cool ones shine with a dull red light, while the hot ones are white or blueish-white. It might be hard to see these rather subtle differences with the naked eye ...
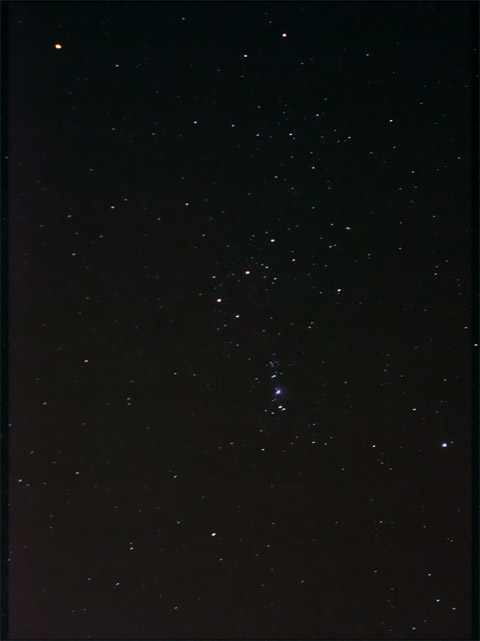
Image courtesy of Denys Sakva
... but you can enhance the colors if you spread the light out to cover a wider area; by defocusing your camera, for example.
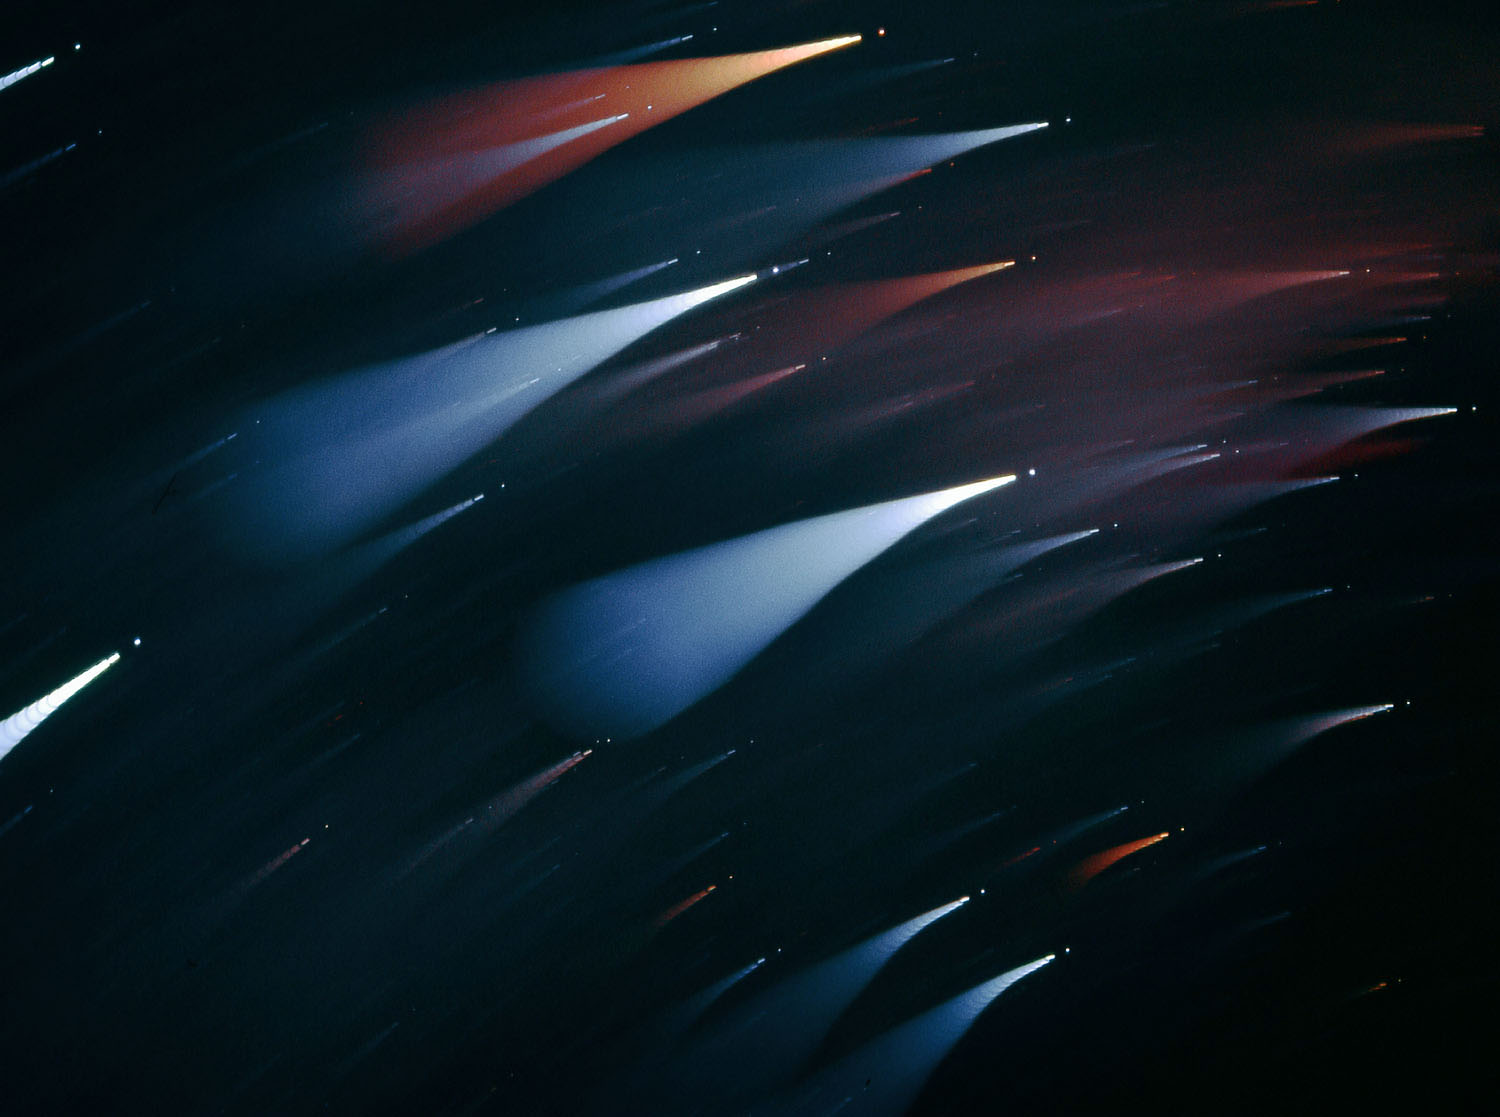
Image from
Astronomy Picture of the Day 2004 July 8, copyright
Stefan Seip.
This connection between color and temperature holds when solid, liquid, or dense gaseous objects emit light over a wide range of wavelengths. We call this blackbody radiation. If you plot the intensity of radiation as a function of wavelength, you'll see a curve with a sharp drop at one side (short wavelengths), and a gradual decline at the other (long wavelengths).
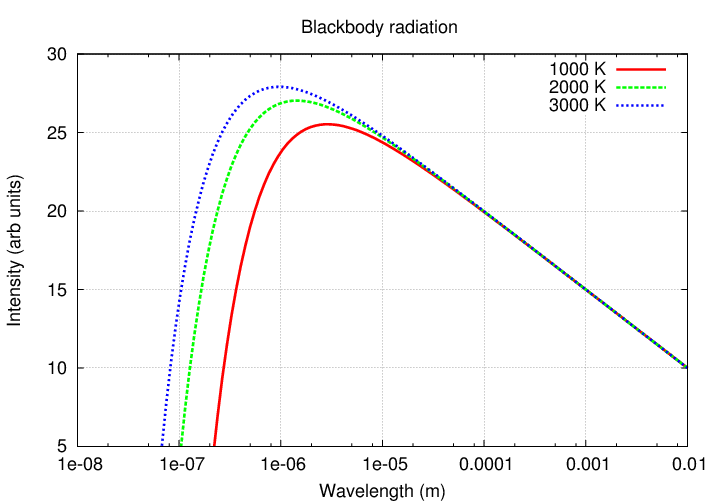
In fact, there is a numerical relationship between the wavelength at which an object emits most of its energy, and the temperature of the object:
Watch a short video explaining this equation
![]()

But, in order to use this technique, we need to break light up into a spectrum in order to measure the intensity at different wavelengths.
Q: How can one break light up into a spectrum?
There are two basic ways of dispersing light. You can pass it through a prism
or you can bounce it off (or pass it through) a diffraction grating
You can read about the physics of diffraction gratings if you want to understand exactly how and why they work.
Now, to represent a spectrum, we can either take a picture -- showing a rainbow-like spread of colors -- or we can draw a graph. The diagram below shows a graph (top panel) and the corresponding picture (bottom panel). The graph shows
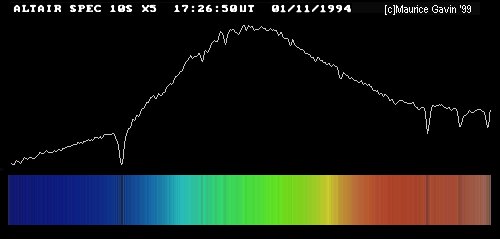
Image by Maurice Gavin, from the wpo-amateur spectroscopy web site.
The usual convention is that short wavelengths (blue light) is on the left-hand side of the graph, while longer wavelengths (red light) appear at the right-hand side of the graph.
Let's do an example: the graph below shows the spectrum of the star Arcturus, stretching from the ultraviolet portion of the spectrum on the left to the infrared region on the right. The visible section runs from about 400 to 800 nm.
Watch a short video doing this example
![]()
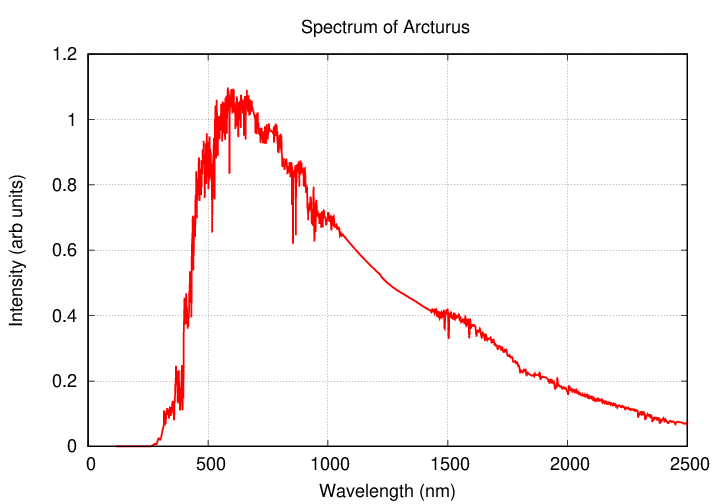
  Q:  At what wavelength (in nm) does this spectrum reach its peak?


  Q:  In order to convert that wavelength to meters, divide by 109.


  Q:  What is the temperature of this star?
When we break light up into a spectrum, we usually see one of three basic types of spectra, depending on the nature of the source. German astronomer Gustav Kirchoff, working in the 1850s, figured out the reason for these different types of spectra. He explained the three basic types of spectra as coming from three different situations:

![]()
![]()
![]()
In a very, very, VERY useful way, each element generates its own unique set of wavelengths of emission or absorption.
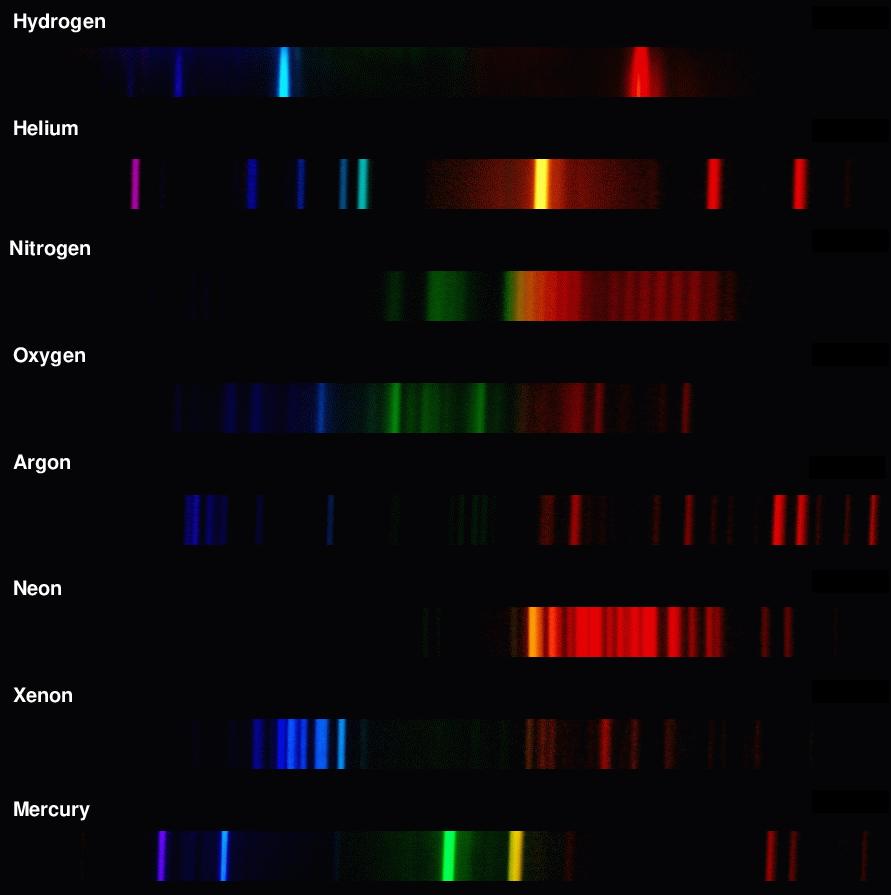
We can use these patterns like fingerprints to identify the material which is emitting or absorbing light.
So, if we can send the light from a star, or a planet, or a cloud of gas, through a spectrometer, and identify the pattern of absorption or emission lines, we can figure out the chemical composition of the object.
But that's not all we can learn from spectra! If we measure the wavelengths of absorption or emission lines very, very carefully, we might notice little differences between the wavelengths we observe in a celestial object, and the wavelengths we observe from the same element in a lab on Earth.
For example, we might observe lines emitted by ionized oxygen atoms:
The difference between the observed, and the laboratary, wavelengths, is related to the speed of the object v and the speed of light c:
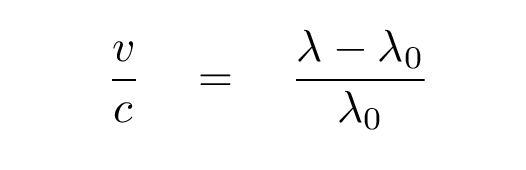
If the difference is positive (observed wavelength is longer than lab wavelength), then the object is moving away from us. If the difference is negative (observed wavelength is shorter), then the object is moving toward us.
In this example,
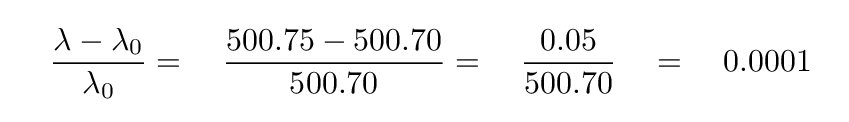
which means that the speed of the gas is 0.0001 * (speed of light) = 30 km/sec, moving away from us.
Let's try using the Doppler shift to find the motion of a real star relative to the Sun. The star Arcturus shines brightly in the summer-time skies -- look for it in the south-west, not long after sunset. You can find it by following the handle of the Big Dipper.
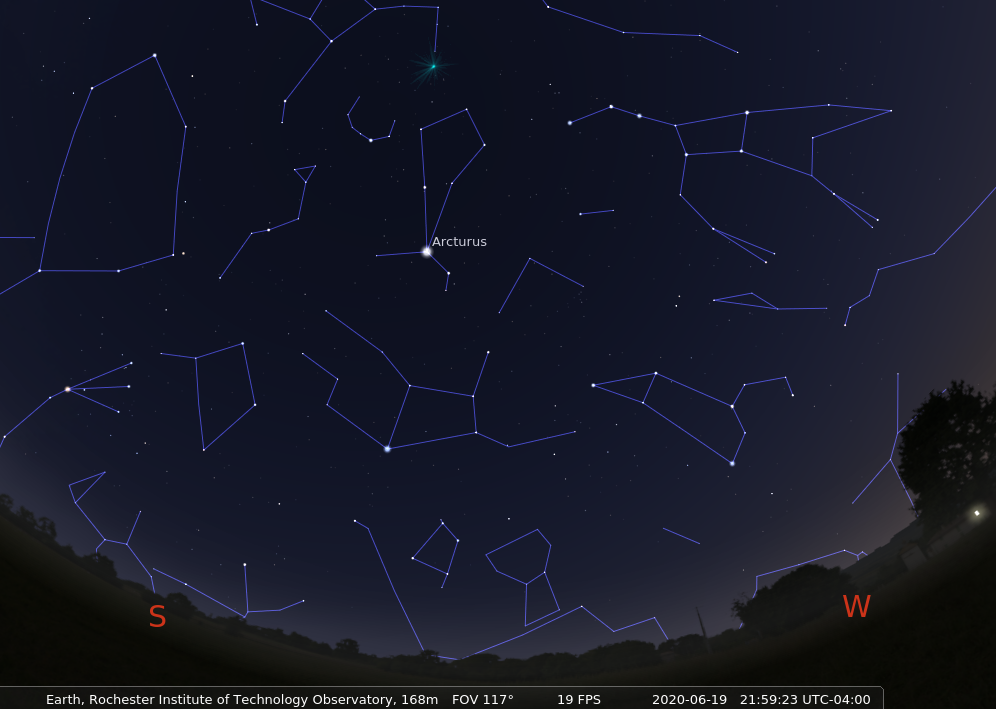
If we pass the light of Arcturus through a spectrograph and record its spectrum, then compare that to the spectrum of the Sun, we see something like this:
  Q:  What is the radial velocity of Arcturus?
      Is it coming towards us, or going away from us?
Watch a video going through these calculations
![]()
Copyright © Michael Richmond.
This work is licensed under a Creative Commons License.