 Copyright © Michael Richmond.
This work is licensed under a Creative Commons License.
Copyright © Michael Richmond.
This work is licensed under a Creative Commons License.
The final big topic for us is "optimization". Whenever you ask questions such as "How large was the voltage spike though the wire?" or "How bright is that galaxy?" or, in general terms, "What are the values of the parameters in some model which cause it to make the best match to our observations?" you are engaging in optimization.
This is a really big and wide-ranging topic. There's no way we could cover it in single quarter, let alone a few weeks. Therefore, I'm going to restrict our discussion to a very specific problem: identifying and measuring the properties of stars in an image. For example, in this image,

you can see a fuzzy galaxy with faint spiral arms near the top, and some reasonably bright stars below it. We can ask quite a few questions about the stars.
(*) Of course, this depends on how you choose to define "brightness."
Now, it turns out that each of these stars should have an identical shape; something like a two-dimensional gaussian function. Below are surface plots for a bright (on left) and faint (on right) star from the image.
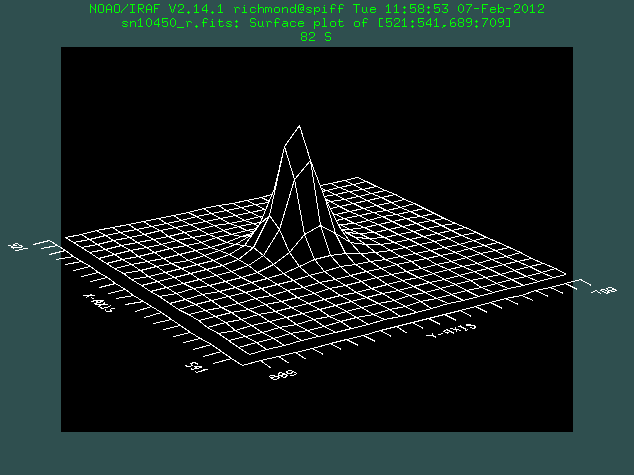
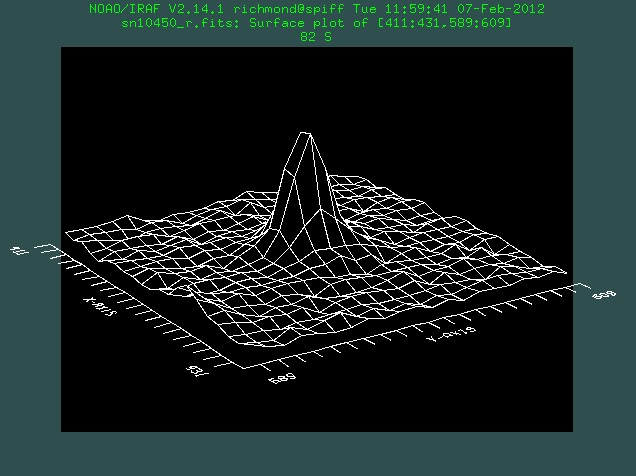
In theory, because the light from all these stars has travelled through very nearly the same long column of air in our atmosphere, the shapes of all the stars should be the same. In particular, the width of these gaussian-like point-spread-functions (PSFs) should be identical. That raises another question:
There are quite a few questions. To answer them, we might begin by defining a model to which we can compare the data. In this case, let's choose a two-dimensional circular gaussian:

This model has 4 parameters which we can adjust:
  Q:  What are the 4 parameters?


  Q:  What does each parameter represent?


  Q:  Which of these 4 parameters are the same
      for all the stars?  Which are different?
(It turns out that a good model would have even more parameters; for one thing, the region of the image around each star has a non-zero background level. However, let's ignore that for now ....)
Given a model, and some data, the task of choosing the "best" parameters -- the ones which cause the model to match the data most closely -- is one example of optimization. In some cases, it may be obvious when the model matches the data in the best way; but in others, it may not be so obvious. We will discover that sometimes, there can be more than one "best" answer, depending on where you happen to look. The bottom line is that this very, very common situation does NOT (always) have a trivial answer.
Let's start our journey into the Land of Optimization with a tidy little daytrip. Consider a series of measurements: voltage as a function of time. We'll pretend that we have a perfect instrument, one which produces no noise. Of course, noiseless instruments are very difficult to find in the real world.
We connect this perfect voltmeter to an electrical system. The system occasionally produces brief spikes of voltage which happen to have an extremely convenient shape and size:
So, if we make measurements with the voltmeter, we would see readings like this:
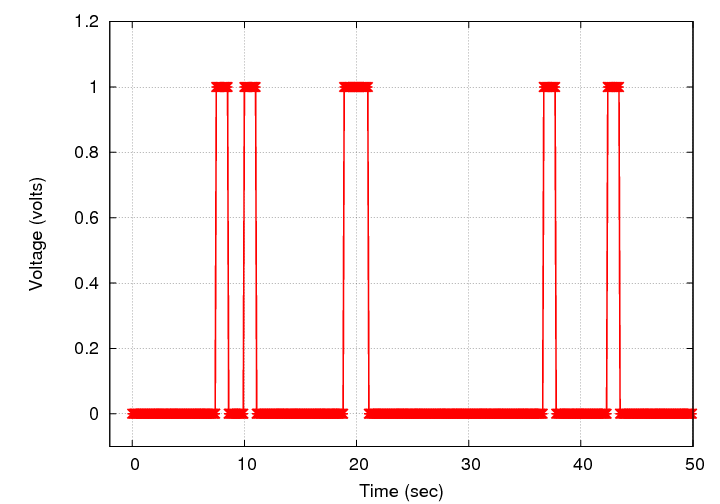
Let's zoom in on one particular spike.
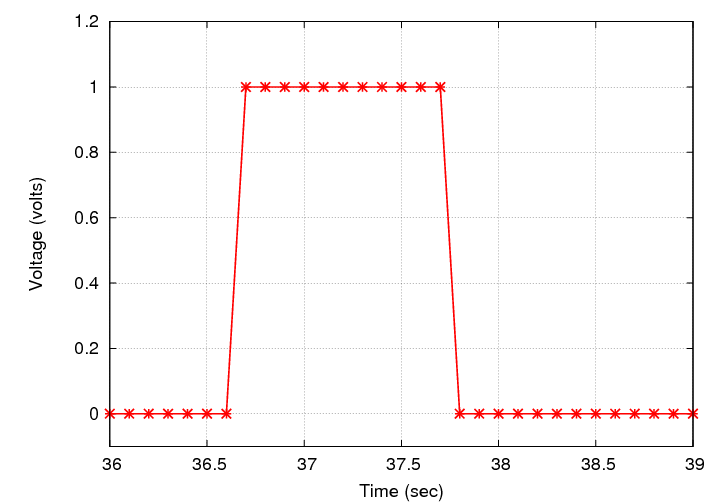
Can you answer the following question?
Q: What is the time of the middle of the spike?
Well, that wasn't too hard. Why not?
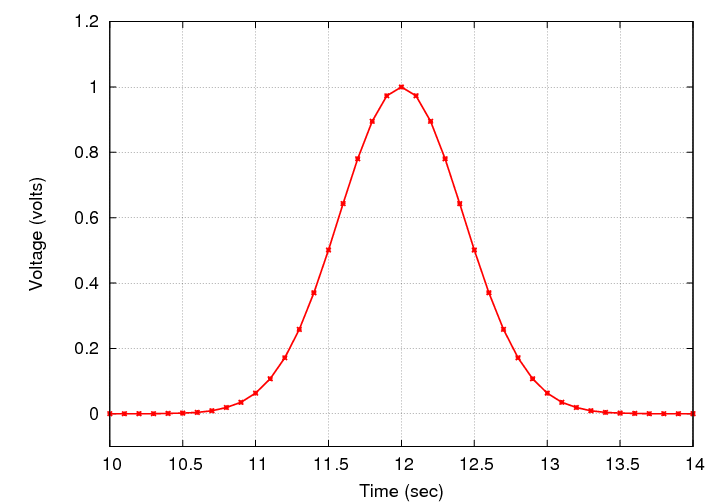
Let's make the situation a bit more realistic. Our signal this time will not be a perfect square wave, but a gaussian. That's pretty common -- measurements often rise and then fall in a gradual manner. So, here's a closeup of one particular voltage spike.
  Q:  What is the time at which this spike reached
      its maximum value?
This took a little more effort, but it was still pretty clear that the middle of the spike was at exactly 12.0 seconds: the measurements were beautfully symmetric around that time, as your eyes can easily determine in a moment.
But what if the spike occurs at some time which does NOT produce such a nice, round time?

  Q:  What is the time at which this spike reached
      its maximum value?
Would it help if we zoom in on the graph?
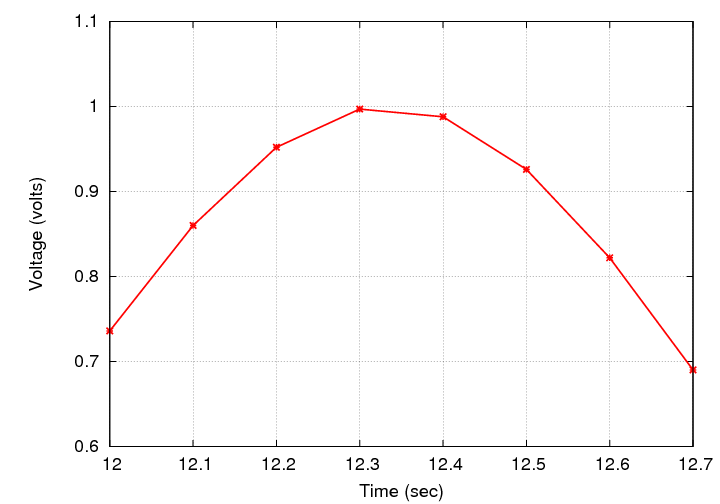
Well, we can tell that the maximum voltage probably occurred somewhere between t = 12.3 and t = 12.4 seconds, but can we be any more precise?
In order to make a quantitative comparison between the data and some model, we need to have a mathematical procedure which turns the difference between the data and model into a number. We can then fiddle with the parameters of the model in order to make the number a maximum (or a minimum, depending on how we define things); when we reach that point, we can declare victory and state that the values of the parameters at that moment are the "best-fit" values.
Now, there is no single mathematical procedure which is the best choice for all physical situations. One must understand the nature of the measurements, their biases and their uncertainties, and the properties of a model, with its own biases, in order to come up with a reasonable mathematical procedure.
For this example, let's adopt a procedure which is very widely used in many branches of physics: the chi-squared criterion. The basic idea is to use the model to generate one output value of our model for each actual measurement, compute the difference between the actual value and the prediction of the model, and then to add up all the SQUARES of those differences.

In the equation above, I've set this sum-of-squares-of-differences equal to "capital K" squared; I'm going to reserve the Greek letter chi χ for a very similar equation a bit later.
If we choose a good model, then the differences will all be relatively small, and so the sum of all the squares of the differences will also be small. Therefore, for this figure of merit, we can optimize our model by choosing parameters which yield a minimum of K2.
Now, let's choose our model to be a very simple one: a gaussian with a fixed amplitude of 1.0 volts and a fixed full-width-at-half-maximum (FWHM) of 1.0 seconds. In that case, the constant in the denominator of the argument of the exponential function is σ = FWHM / 2.35 = 0.4255 sec, and our model looks like this:
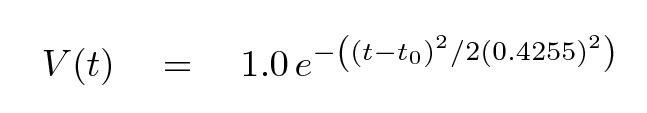
There is just one parameter for us to vary: the time t0 at which the model reaches its peak voltage.
  Q:  So, how can we find the best value
      of this parameter t0?
Copyright © Michael Richmond.
This work is licensed under a Creative Commons License.