 Copyright © Michael Richmond.
This work is licensed under a Creative Commons License.
Copyright © Michael Richmond.
This work is licensed under a Creative Commons License.
You can read an image into MATLAB using the imread command. For example,
img = imread('m101.ppm', 'ppm');
will read the image you need to analyze for the final project. The first argument is the name of the image, and the second argument describes the format of the image. This picture of M101 is a "Portable Pixmap". MATLAB can read many different types of image, such as PNG, GIF, JPG, etc.
In the command above, the pixel data has been stored in a matrix called img. This particular image has a size of 340 x 510 pixels. MATLAB treats this matrix as it would any another matrix: you can add or subtract values to each element, or add this matrix to another of the same size, or compute the invert of the matrix.
You can display the image using the image command:
image(img);
On my computer, this causes a new window to pop up, like this:

In this particular case, the colors provided by MATLAB in this default colormap don't mean much: they just help you to estimate the intensity of each pixel. You can see that more easily if you use the "colormap" button on the graph window to create a colormap to the side of the image. Note that adding the colormap bar will squish the image slightly!

This image of the galaxy M101 is really a greyscale image: each pixel represents the intensity of light which passed through a red filter and struck the CCD detector. It might be more reasonable to display it as a greyscale image. You can change the colormap and then re-display the image like so:
  colormap('gray');
  image(img);

If you use the "pixel button" in the image window, you can examine the coordinates and intensity value of each pixel interactively.
![]()
Note that MATLAB has a somewhat counterintuitive way of referring to the image data. The image display has this orientation:

When you refer to the image data in a matrix within MATLAB's memory, the convention is
value = img(200, 50);
will retrieve the value of the pixel at Y=200 and X=50. In other words, MATLAB's matrix system refers to pixels as matrix(Y, X) .
![]()
You can create a sub-image, containing only the pixels within some small sub-region, using the regular MATLAB syntax for matrices. For example, to create a small sub-image centered on the middle star,
  starb = img(228:248,257:277);
  image(starb);
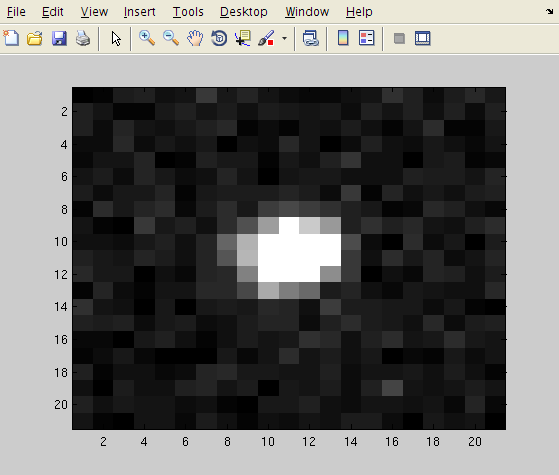
When you write your program, it might be handy to create a small matrix containing only the pixels around some point of interest before you go deeply into calculations.
Now, when you first read an image into memory using imread, the matrix which is created will have a type of uint8, which means "unsigned integers with 8 bits". If you want to perform many mathematical operations on this matrix, it will be much more convenient to convert all the values into "double-precision" format. You can do that like so:
new_img = im2double(img, 'indexed');
If you want to convert the matrix back into an image format, so that you can save it as a JPG or PNG or PPM file, use
new_mat = im2uint8(mat);
To write an image back into a file that other programs can read or display, use the imwrite command. The file extension you provide for the image name will tell MATLAB which format it should write; in order to save an image in JPEG format, for example, you could type
imwrite(m101, 'm101.jpg');
Copyright © Michael Richmond.
This work is licensed under a Creative Commons License.