 Copyright © Michael Richmond.
This work is licensed under a Creative Commons License.
Today, you will
In order to turn a raw image into one which accurately reflects the amount of light which struck each pixel, you need to "clean" it. There are two steps involved in cleaning our images of asteroid Lictoria:
First, copy a raw target frame into your directory:
      cd
      cp mar30_2002/1107a.001 richmond
      cd richmond
Next, do the dark subtraction
cp 1107a.001 copya.001
sub 1107a.001 dark15.fts
Now, do the flatfielding
mn flatv.fts
div 1107a.001 flatv.fts flat
Congratulations! The file 1107a.001 should be at this point nice and clean. The pixel values in the image should now represent fairly the amount of light which struck the CCD.
Your clean image isn't very meaningful unless you know which way is North, which way is East, how big the field of view is, and so forth. You need to determine the plate scale (arcsec per pixel) and orientation. Once you know these parameters for one image, you'll know them for all the images taken during a night (and, usually, all the images taken with the same telescope and camera).
The image 1107a.001 was taken on the night of March 30, 2002. The time of the exposure is recorded in Eastern Standard Time in the FITS header. Use the buffers command to look it up. Then convert to Universal Time.
Look up the location of the asteroid 1107 Lictoria at the time and date of the exposure, using the JPL Ephemeris site. Make a finding chart using the Aladin tool.
Match the finding chart to the displayed image. Which way is North? Which way is East?
Exercise:
- Make a picture of the image window with the directions labelled, something like this:
                    -----------------
                    |     North     |
                    |               |
                    |West      East |
                    |               |
                    |     South     |
                    -----------------
Next, you must figure out how many arcseconds per pixel in the image. Use the Aladin tool's Vizier option to display an overlay for stars in the USNO catalog. The Dist button will show you the distance between any two stars. Pick two reasonably bright stars which appear both in the finding chart and in the image.
Compare your answer to that of other students. You should all get the same answer...
You can check your result: if you know the focal length of a telescope and the physical size of each pixel in a detector, you can calculate the pixel scale via
                                             -1  ( pixel size D  )
      angle subtended by each pixel   =   sin    (---------------)
                                                 ( focal length L)
![]()
Exercises:
- Look up the size of pixels in a Kodak KAF-1600 CCD chip
- Calculate the focal length of the Meade 10-inch telescope with an f/6.3 focal reducer
- Calculate the expected pixel scale
- How does this compare to the actual pixel scale?
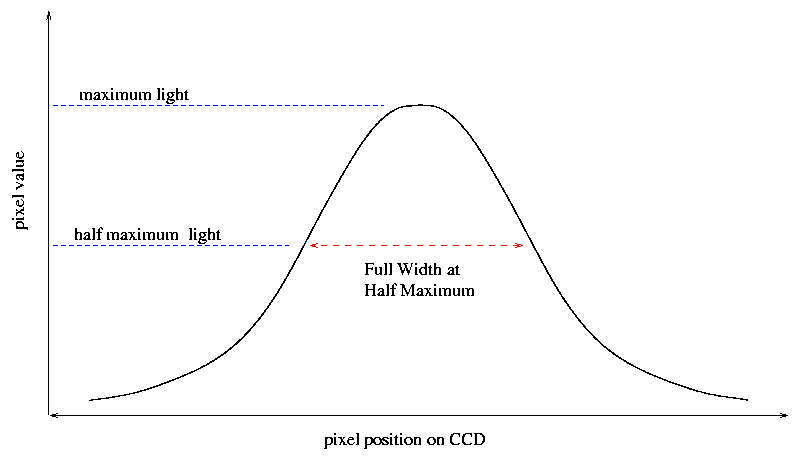
One measure of an image is the shape and size of the Point Spread Function (PSF). If the telescope is focused properly and the atmosphere is stable, stars will appear to be tiny little round points of light. But if the telescope isn't focused, or the air is turbulent, stars will appear as fuzzy blobs. The more area over which a star's light is spread, the harder it is to measure precisely.
The conventional way to measure the size of a PSF is by its diameter at a level of half the maximum pixel value:

This FWHM is roughly the same for all the stars in an image, bright and faint alike. The smaller the PSF, in general, the better one can measure stellar properties.
Yes, yes, if the FWHM is much less than two pixels, then the sources aren't properly sampled.
Good astronomical sites, located high on mountaintops where the airflow is laminar, routinely record FWHM values of less than one arcsecond. Telescopes in space have a FWHM set by diffraction.
You can use XVista's tv window to find the FWHM of stellar sources in an image, in two ways:
Method one:
        row     col       pixel value       pixel - background
       --------------------------------------------------------
Method two:
This radial profile shows the (pixel - background) values on the Y-axis, and the distance of each pixel from the center of the star on the X-axis. The program fits a gaussian curve to the data, and plots the fit as a solid line. It prints the parameters of the fitted gaussian at the top of the window: central row, central column, FWHM, eccentricity.
Repeat both methods to find the FWHM of two bright stars and two faint stars.
Exercises:
- How does your values compare to the values found by XVista?
- Convert XVista's average value of FWHM from units of pixels to units of arcseconds.
- Is the RIT Observatory at a good site?
 Copyright © Michael Richmond.
This work is licensed under a Creative Commons License.