 Copyright © Michael Richmond.
This work is licensed under a Creative Commons License.
Copyright © Michael Richmond.
This work is licensed under a Creative Commons License.
Let's look at the images from Sep 20, 2003, again. Use the "tv" command to display the image v585.fit. You should see lots of stars, and lots of hot pixels, all superimposed on a roughly uniform background.
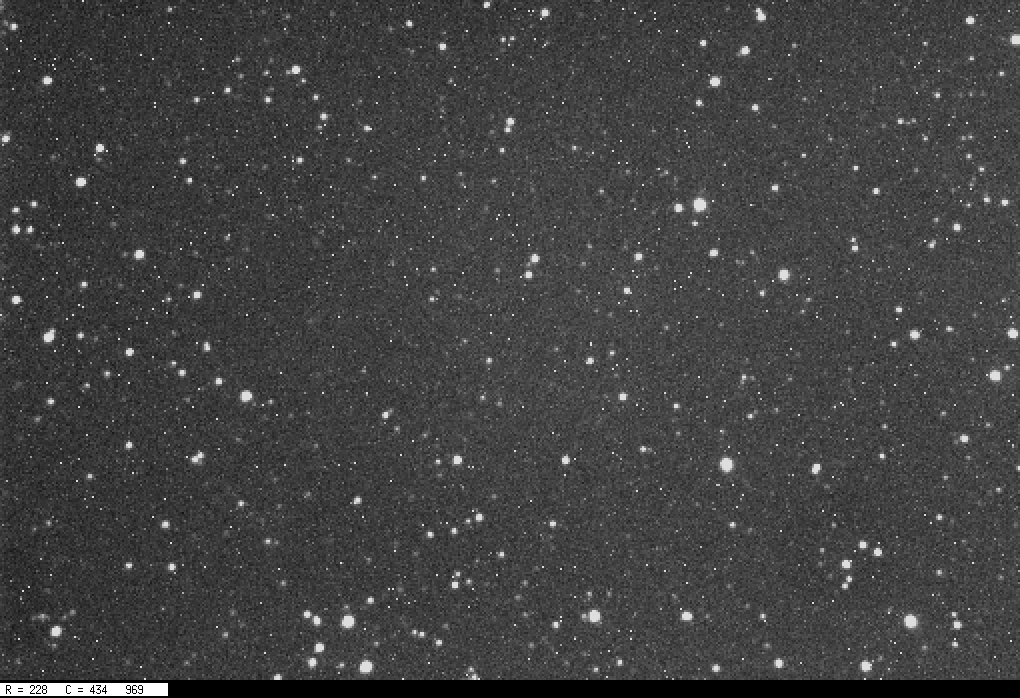
Suppose we are interested in the background level -- how could we determine its value?
One way is the use the "mn" command to compute the arithmetic mean, or average, of all the pixel values.
Check these values by zooming in on a small section of the image and picking 10 different pixels. Make sure that each pixel is not a hot pixel, and that it has no starlight. Write down the values of those 10 pixels.
Do you see a problem here?
You can learn a lot about the statistical properties of an image by making a histogram of the pixel values.
It turns out that when there are even a small number of pixels with values which are MUCH higher than the typical background value (due to stars, or cosmic rays, or a bright nebula, or whatever), those pixels can affect the calculation of the mean value greatly. If what you really want to know is the typical value of the background, it might be better to ignore all those high pixels and concentrate on the majority of the pixels, which are clustered around relatively small values. The XVista command "sky" tries to do that: it fits a gaussian function to the histogram of pixel values, and reports the location of the peak, as well as the "sigma" of the gaussian function. This "sigma" is roughly 40 percent of the Full-Width at Half-Maximum (FWHM) of the gaussian fit.
sky v585.fit
Copyright © Michael Richmond.
This work is licensed under a Creative Commons License.