 Copyright © Michael Richmond.
This work is licensed under a Creative Commons License.
Copyright © Michael Richmond.
This work is licensed under a Creative Commons License.
Step-by-step guide to calculating gain
So, I'll show you how I calculated one point for the
plot of variance versus signal.
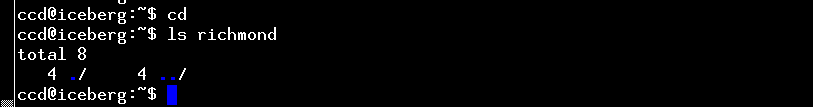
- connect to the iceberg machine. My directory starts out empty
(in order to delete any files in my directory,
I could type /bin/rm -f richmond/* )
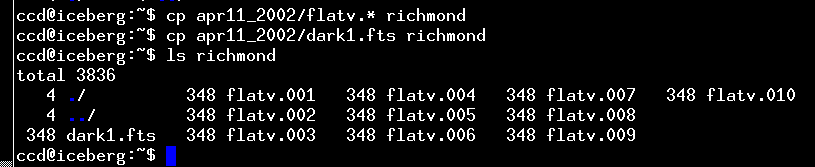
- copy a set of V-band flats, and a master 1-second dark frame,
from the Apr 11 directory into my home directory
- change my copies of the images from write-protected to write-able
(so that I can modify them as I wish)

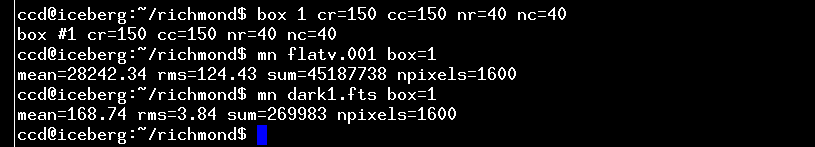
- define a box near the middle of the image, and calculate the mean
and RMS (also called standard deviation) of the pixel
values in one of the raw flatfields, and in the master dark
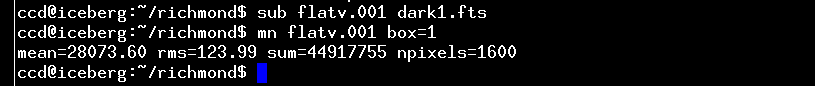
- subtract the master dark from flatfield image 1. When I calculate
the mean value in the flatfield image, note that it is lower
than the original mean value (which was 28,242 counts).
The new mean value for flatfield 1 is 28,073
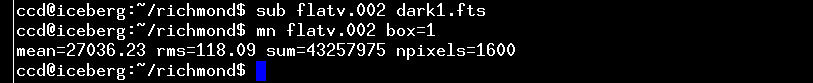
- subtract the master dark from flatfield image 2, the second
image in the pair I will use to find gain. The mean
value after dark subtraction is 27,036.
- now, I need to make the two flatfield images have roughly the same
mean value before I can subtract one from the other.
So, I will scale the first one to match the second.
First, I make a copy, called "foo.fts". Then, in a single
step with the div command, I divide
foo by 28,074 (the mean of flat 1) and multiply by
27,036 (the mean of flat 2). The result is that the
copy ends up with the same mean value as flatfield number 2.
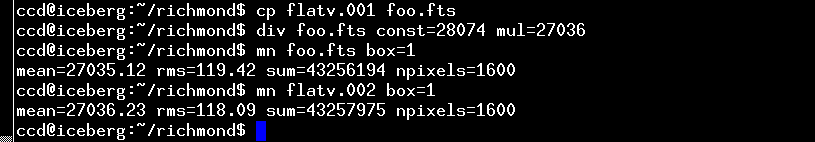
Write down the mean level in the box at this point:
mean = 27036 counts
Phew. At this point, I have two CCD images, from which the dark
current has been subtracted. The two images now have the same
mean value, so when I subtract one from the other, I should end
up with an average pixel value of close to zero.
- subtract flatfield number 2 from the scaled copy of number 1

Good. The mean value is close to zero. Write down the
RMS value in the box -- that's the standard deviation
in counts.
stdev = 138 counts
- Now, we convert the standard deviation into the variance;
and then divide by two, because we've combined two
different images to get this difference image.
          variance  =  (stdev * stdev) / 2

                    =  ( 138  *  138 ) / 2

                    =      9522
All done. We will place a point on the graph
of variance versus mean level, at mean=27036, variance=9522.
After plotting similar points for other pairs of images,
we can fit a straight line to the graph.
The gain, electrons per count, is the reciprocal of the straight line.
Copyright © Michael Richmond.
This work is licensed under a Creative Commons License.