 Copyright © Michael Richmond.
This work is licensed under a Creative Commons License.
Copyright © Michael Richmond.
This work is licensed under a Creative Commons License.
As light passes through Earth's atmosphere, it suffers from two types of degradation:
Consider light rays from a particular star as they head towards a particular observer on the Earth's surface. As light makes its way through the Earth's atmosphere, some photons collide with atoms, molecules, water droplets, grains of dust, and other objects. These photons may be absorbed by the objects (in which case they cease to exist), or they may be scattered into a different direction. Either way, they no longer reach the observer on the ground. As a result, the observer detects fewer light rays from the star than he would have seen on an air-free planet. We call this dimming of stellar light extinction.
Clearly, the amount of extinction depends on how much air light rays must traverse. Astronomers have devised the term airmass method to describe this quantity: one airmass is the amount of air directly above an observer. So, if you are looking at a star at the zenith, you are looking through one airmass.
If, however, your target is some angular distance away from the zenith, indicated by the zenith angle z in the diagram above, then its light travels a longer distance through the Earth's atmosphere before it can reach you. To a reasonable approximation, one can consider the Earth and its atmosphere to be flat, parallel slabs. In that case, the distance light travels is
                          one airmass
           airmass  X  =  -----------  =   (one airmass) * sec(z)
                            cos(z)
So, we can easily calculate how many airmasses
light must traverse to reach us from an object at any
given location in the sky.
One can calculate the relationship between airmass and extinction both theoretically and empirically. Theoretically, as long as the fraction of light lost is small, one can describe the intensity of light, I, as a function of airmass, X, as
                        -cX
        I(X)  =  I  * e
                  0
where I0 is the original, exoatmospheric
itensity of light from a star,
and c is some factor
which depends on the properties of the atmosphere
and the wavelength of light
(blue is extinguished a lot, red is extinguished less).
If we measure brightness in magnitudes, then the relationship becomes conveniently linear:
        m(X)  =  m   +  k*X
                  0
where m0 is the exoatmospheric magnitude,
and k is again some constant which depends
upon properties of the local atmosphere and
the wavelength of light.
We call the coefficient k
the "first order extinction coefficient."
If one observes through the standard Johnson-Cousins UBVRI
filters, one finds typical values
   passband         k
 ----------------------
      U            0.6
      B            0.4
      V            0.2
      R            0.1
      I            0.08
The better the observing site,
and the clearer the night,
the smaller the extinction coefficient.
If one is trying to correct for extinction,
one must determine the first-order coefficient
since the air changes from one night to the next;
in fact, some astronomers solve for
variations in extinction over the course of a night.
Below are measurements of the raw, instrumental magnitude of "Star A", observed for many hours at the RIT Observatory on UT July 27, 2001. Can you figure out the first-order extinction coefficient on this night?
Exercises:
- The star Sirius has RA = 06:45:09, Dec = -16:42:58. RIT Observatory is located at longitude 78 degrees West, latitude 43 degrees North. When Sirius is at its highest in the Rochester sky, what fraction of its light actually reaches us? Assume one is observing in V-band.
- The bright star Mintaka (one of the stars in Orion's belt) passes nearly overhead to observers on the equator. For those observers, what is the longest continuous stretch of time during which the airmass of Mintaka is less than 2.0?
- What is the first-order extinction coefficient implied by the RIT measurements of Star A? Can you guess the passband of the data?
- What was the maximum fraction of the exoatmospheric light from Star A which reached the telescope?
As light makes its way through the Earth's atmosphere, it passes through many different layers of air. Each layer has a slightly different temperature, pressure and density; there may also be slight differences in chemical composition, dust and water content. That means that the index of refraction of each layer is a little different. As ray of light travels from layer to layer, it is bent by slightly different angles. By the time it reaches the ground, the ray has probably shifted to a slightly different position than it would have had in the absence of an atmosphere:
The atmosphere is constantly in motion, with air at different altitudes moving in different directions at a range of speeds. Light rays passing through the layers are refracted by constantly changing amounts. On timescales of tens of milliseconds, the apparent position of a star will change by fractions of an arcsecond:

If one looks at a bright star through a small telescope, one will see stars "dance" in a high-power eyepiece. As long as the telescope is small enough that it samples light rays passing through a narrow cylinder of air (typically 10 to 30 centimeters in diameter), then all the stars will appear to move together in unison -- because the light rays from each are being distorted by the same blobs of air.
But if one looks through a large telescope, big enough that it collects light rays which have passed through several different blobs of air, the view changes. A big telescope will show several images of each star, shifted slightly relative to each other due to the slightly different indices of refraction in the blobs of air through which light rays have passed; the result is a blurry multiple image.
For example, compare these images of Jupiter taken above the Earth's atmosphere (by the 2.4-meter HST), and below the Earth's atmosphere (by the 2.1-meter Nordic Optical Telescope):
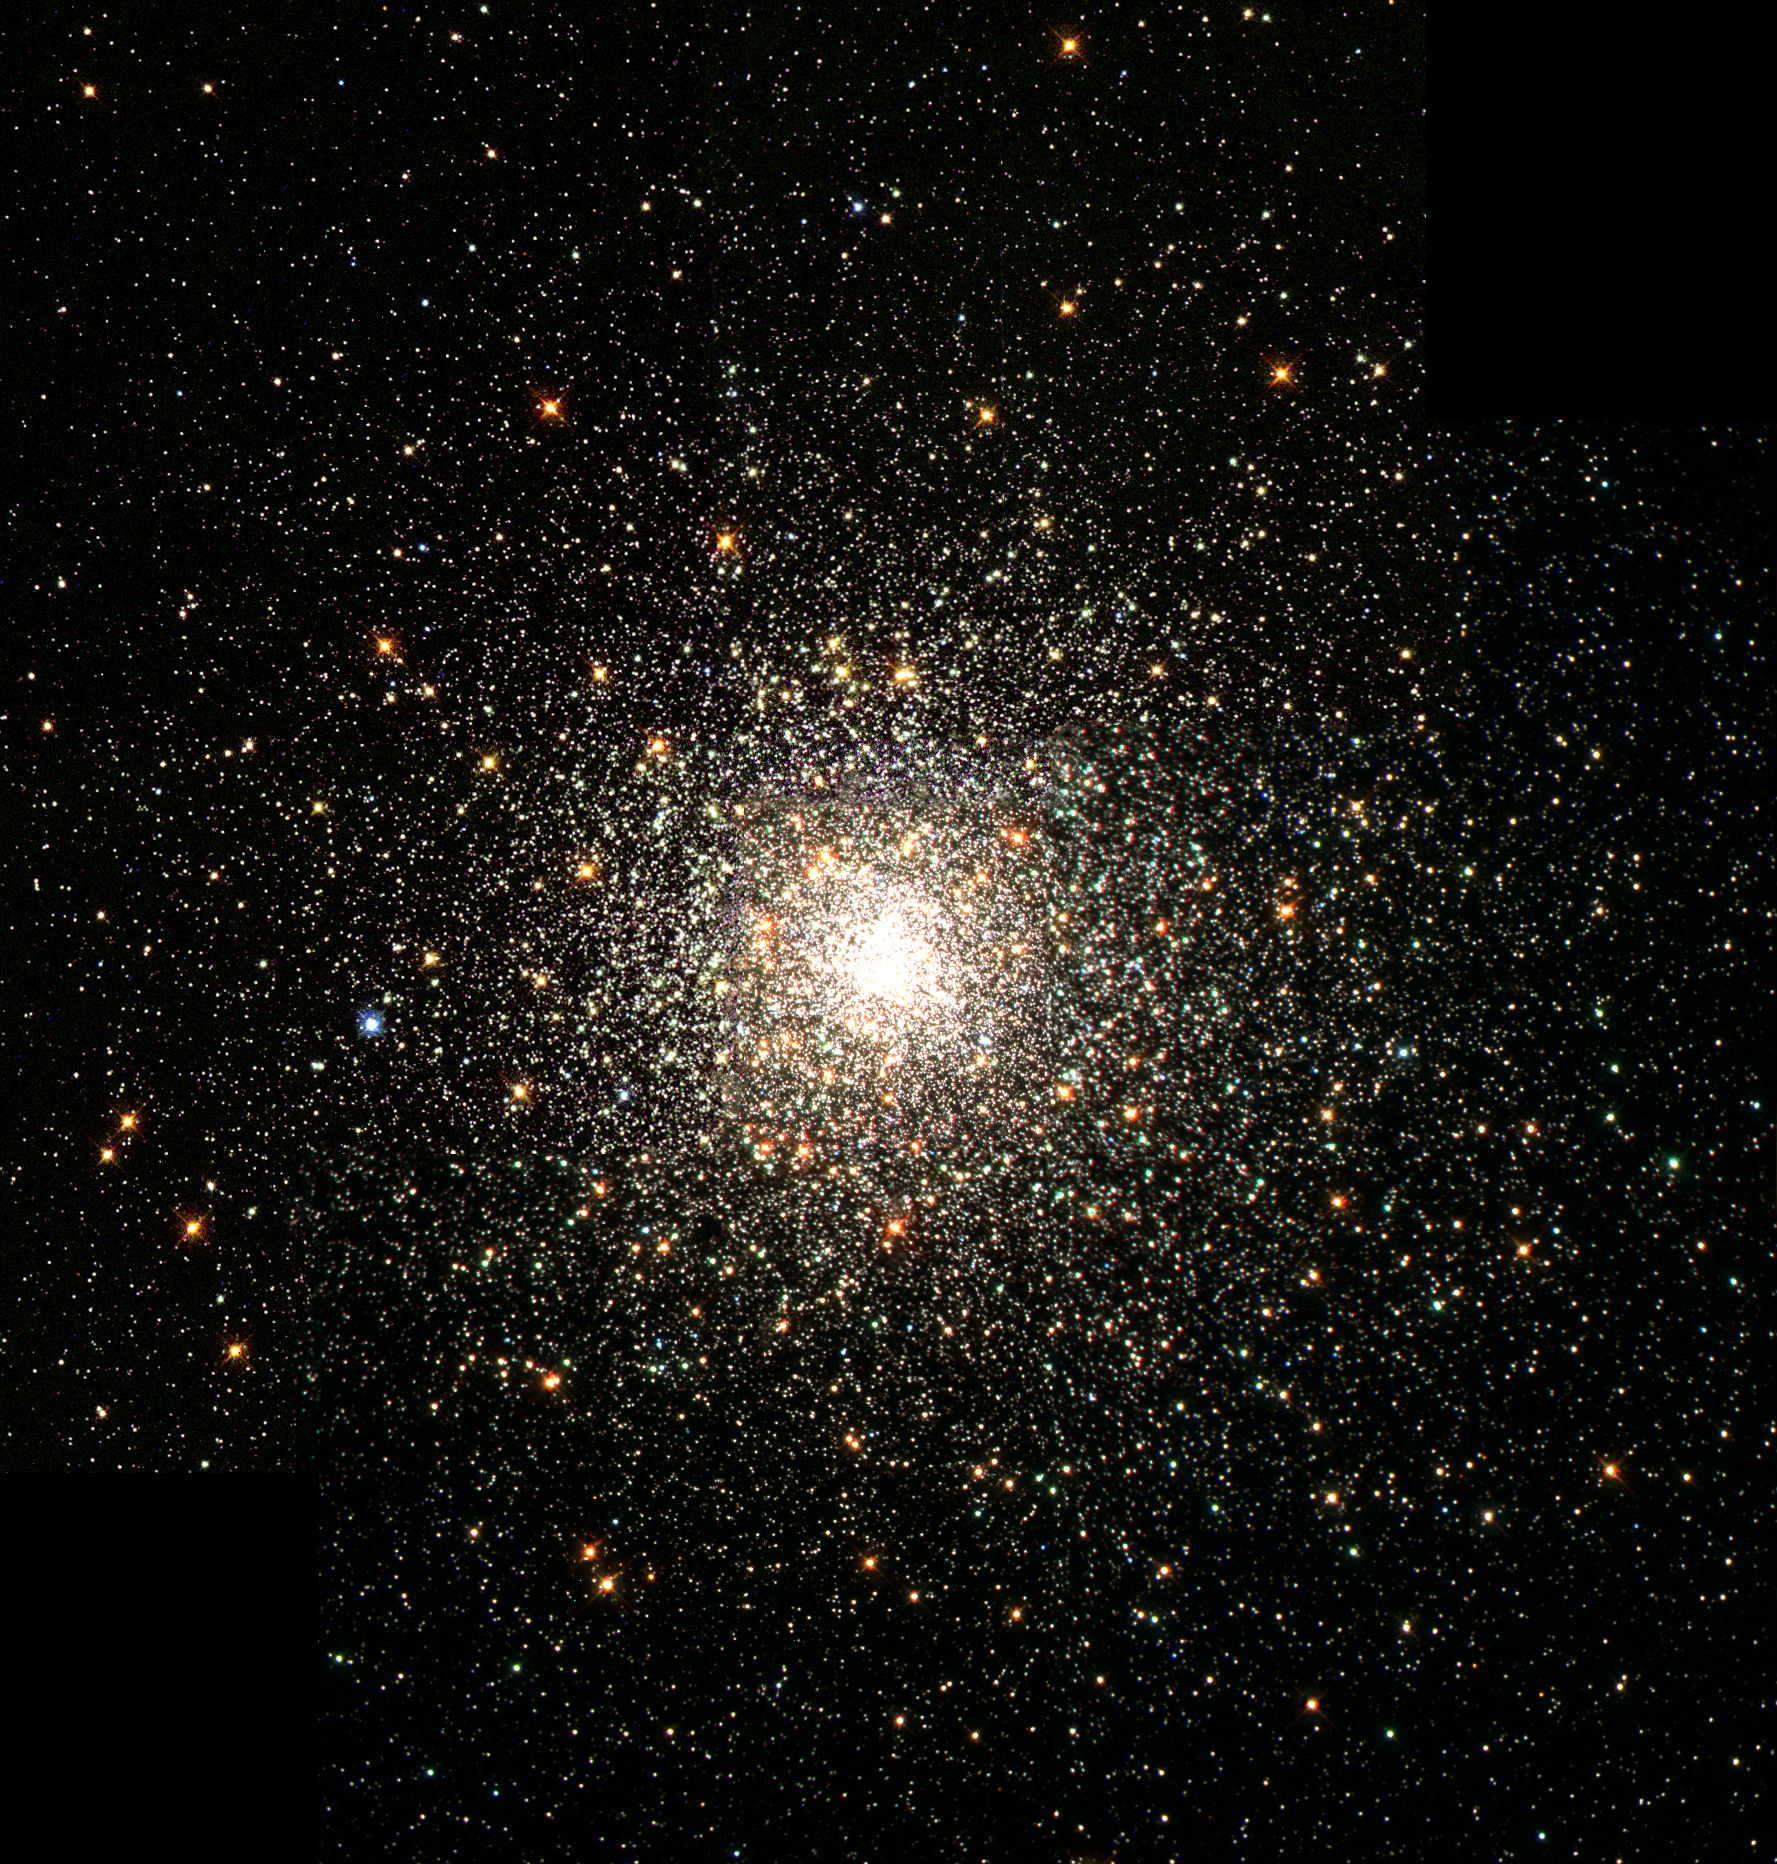
These images of the globular cluster M80 show the effect of the Earth's atmosphere on stellar images; again, an HST image on the left, and a ground-based image (from the 3.5-meter WIYN telescope) on the right.
In addition to making images fuzzy, the atmosphere can also change their color. The picture below shows the star Sirius -- which is really a nice, constant blueish-whitish star. The photographer pointed his telescope at Sirius, opened the shutter, and tapped the telescope; the motion of the telescope caused the light of the star to wander back and forth during the exposure. But look at the change in COLOR!
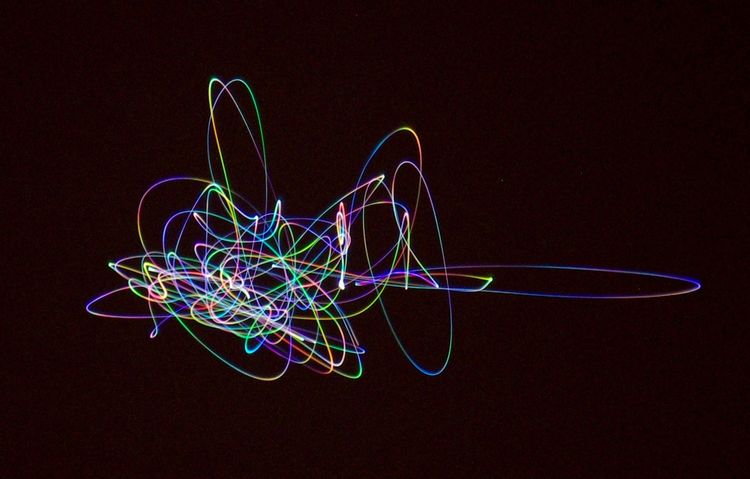
For all the details, see
David Lynch's
Earth Science Picture of the Day for Jan 23, 2012
Astronomers refer to the blurring effect of the atmosphere as seeing. The amount of blurriness depends on the properties of the atmosphere through which light passes. Observatories on mountaintops suffer less than those at sea level, simply because they intercept light before it must pass through the dirty, turbulent lower reaches of Earth's atmosphere. As a general rule, an Earth-based telescope can't resolve features smaller than about 1 arcsecond; the seeing is a bit better on mountaintops, and worse down below. At the RIT Observatory, the seeing is typically 2 to 3 arcseconds. The image below shows a CCD image of an area in the constellation called Sagitta.
If we zoom in on a bright star and look at the individual pixel values as a function of distance away from the peak (a so-called radial profile), we see this:
The dots show the actual pixel values; the solid line is a gaussian curve which best represents the data. Astronomers commonly use gaussians to fit stellar images, since they are pretty good approximations in most cases. We describe the sharpness of the stellar images by their Full Width at Half Maximum, or FWHM for short. In this particular instance, the FWHM was about 1.67 pixels, or about 3.7 arcseconds (since the RIT 10-inch telescope with CCD yields a scale of about 2.2 arcsec per pixel). You can see the FWHM if you zoom in and change the contrast:
Depending on the telescope, camera, atmospheric conditions, and focus, the FWHM of an astronomical image can vary quite a bit. Most astronomers aim for a FWHM of 2 to 4 pixels, but not always ...
Exercises:
- What is the FWHM of the radial profile shown below?

As the winds blow, the images all dance independently, making the blurry image shake, rattle and roll.

The net result of multiple images all moving around on millisecond timescales is pretty ugly. The movie below shows the appearance of the bright star Betelgeuse through the 4.2 meter Isaac Newton Telescope at La Palma. Each frame of the movie is 30 milliseconds long.
Some astronomers take a series of very short exposures of stars in order to "freeze" the motion. By analyzing each frame of a high-speed movie, one can in some cases build up a model of the light distribution without the atmospheric distortion. This technique is called speckle interferometry.
Look at the difference between this raw sequence of speckle images taken with the Russian 6-meter telescope (on the left) and the result of speckle processing (on the right):
You can even watch as some specialized software deconvolves a speckle movie in real-time!
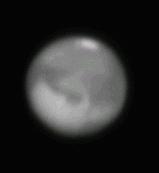
Atmospheric turbulence affects our view of planets as well as stars. Mars, for example, appears to wobble and shimmer as if we were looking at it in the distance over an asphalt road on a hot summer day. Even under good conditions, pictures aren't very sharp, as this image from the RIT Observatory shows:
But if one "stacks" tens or hundreds of these somewhat blurry images, one can build up enough signal to permit certain types of deconvolution, yielding a sharper image:

It takes quite a bit of work to do:
Fortunately, there are several programs available for free, written by amateur astronomers, for amateur astronomers.
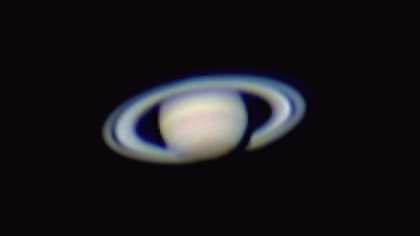
Here's an example: on April 8, 2005, at the RIT Observatory, we used webcam to capture movies of Saturn and Jupiter through our 12-inch telescope. If you watch the movies, you can see how the atmosphere causes the images to shiver and ripple.
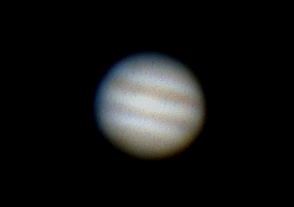
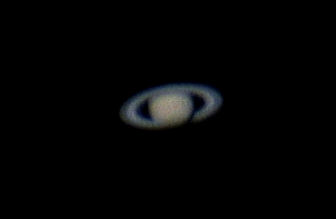
But when I used Registax to discard roughly half of the frames from each movie, keeping only the sharpest ones, and then shifted-and-stacked the remaining frames, and then did a little sharpening, I ended up with a halfway decent picture of each planet:
Some amateur astronomers produce really good pictures of Mars -- as shown by this comparison of an HST picture and one taken with a Meade 10-inch telescope.
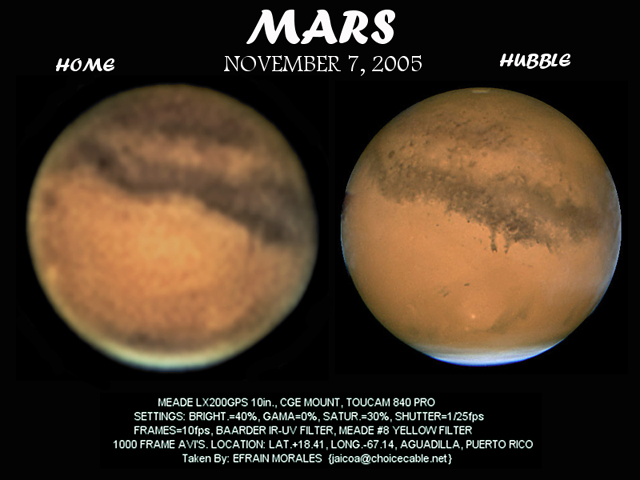
You can see loads of other excellent, high-resolution images of Mars from its 2005 opposition at the Marswatch site.
For more information on speckle imaging, see
Copyright © Michael Richmond.
This work is licensed under a Creative Commons License.