 Copyright © Michael Richmond.
This work is licensed under a Creative Commons License.
Copyright © Michael Richmond.
This work is licensed under a Creative Commons License.
The LMC serves as a crucial midway point between the stars of our own Milky Way Galaxy (which we have some hope of studying in detail) and galaxies in the distant universe (which we can't study in detail). Astronomers use it as a milepost, measuring the distances to other galaxies relative to the LMC.
For example, the first in a series of landmark papers using the HST to determine distances to other galaxies and thus measure the Hubble constant begins as follows
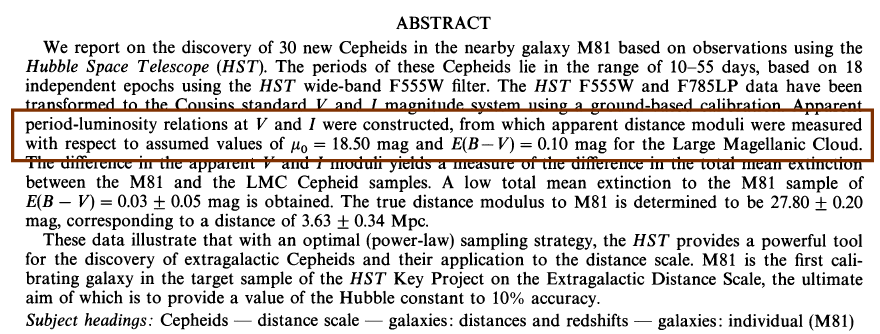
It is therefore very important for us to measure the distance to the LMC. But how can we do it?
Stars evolve off the main sequence when they run out of hydrogen in their cores. They travel up into the red giant region of the HR diagram, reach a maximum luminosity, then slide back along the asymptotic giant branch after helium fusion begins.

Image courtesy of
B.J. Mochejska, J. Kaluzny (CAMK), 1m Swope Telescope
It turns out that the maximum luminosity of stars on the red giant branch depends on their metallicity ... but by a nice coincidence, the various effects of chemical composition appear to cancel each other out if one measures light in the I-band.
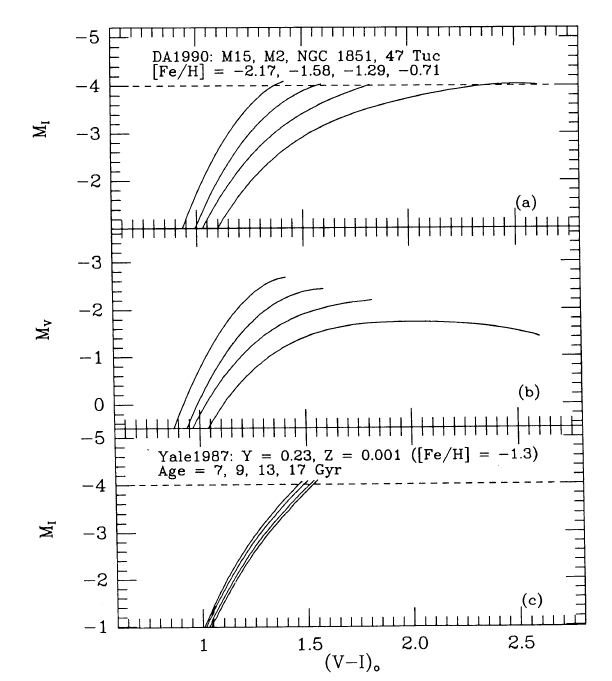
Figure taken from
Lee, Freedman and Madore, ApJ 417, 553 (1993)
How can you recognize the location of this feature in a color-magnitude diagram which is full of outliers and contaminating stars? One approach is to make a histogram of the number of stars as a function of I-band magnitude, and look for a jump in the numbers. In the figure below, the tip of the RGB is estimated to be at M(I) = 18.25 +/- 0.10 mag.
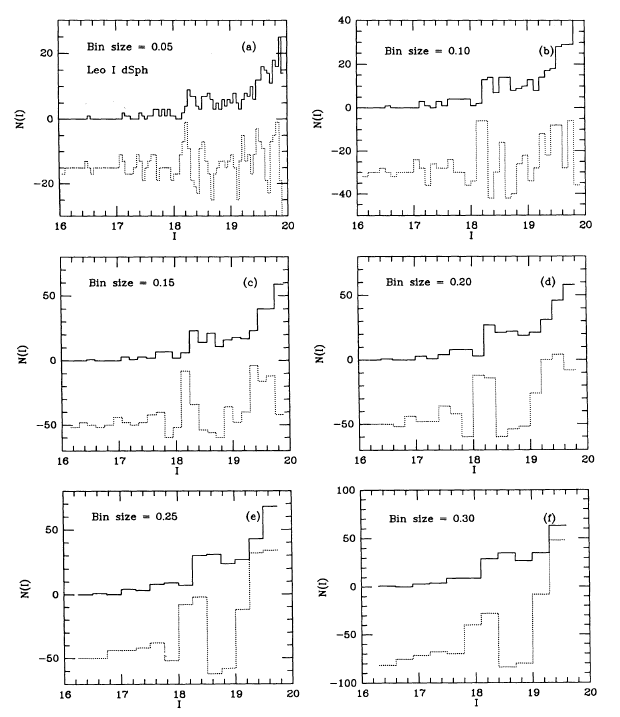
Figure taken from
Lee, Freedman and Madore, ApJ 417, 553 (1993)
Consider this color-magnitude diagram from a field in the LMC.
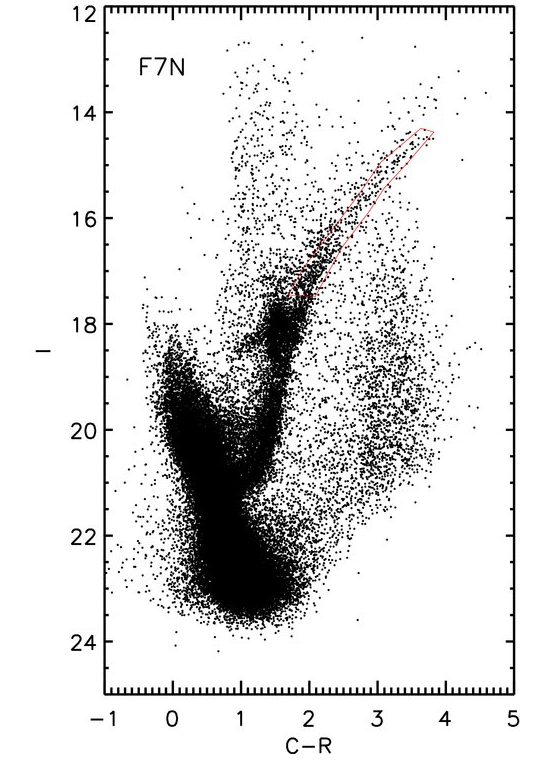
Figure taken from
Saha et al., AJ 140, 1719 (2010)
  Q:  Use the TRGB to estimate the distance modulus
      to the galaxy from which this color-magnitude
      diagram was taken.
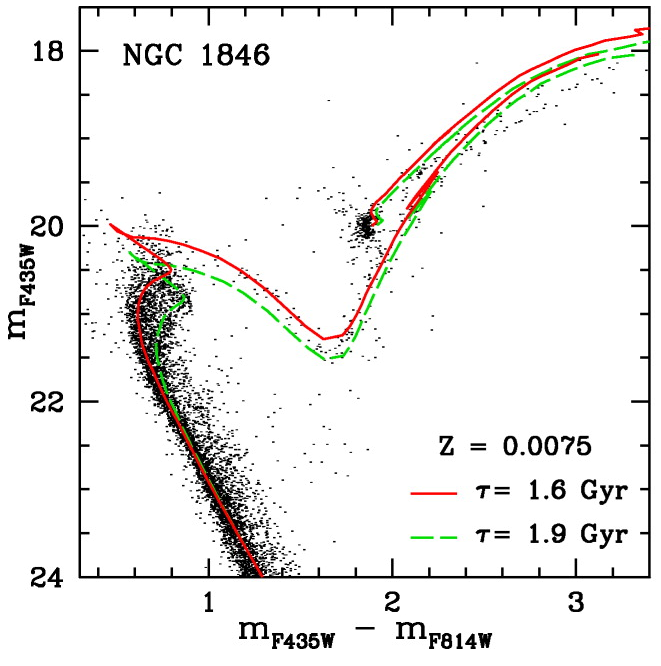
Figure taken from
Mackey et al., ApJ 681, 17 (2008)
Figure taken from
Saradejini et al., AJ 118, 2894 (1999)
Figure taken from
Gim et al., PASP 110, 1318 (1998)
Stars which are fusing helium in their cores spend a reasonably long time -- about 1/10 of the time they spend on the main sequence -- sitting still on the HR diagram. We therefore see a "clump" of stars on the descending side of the red giant branch, which has gained the name of "red clump." Here's a color-magnitude diagram from a cluster in the LMC which shows the clump clearly.
Figure taken from
Mackey et al., ApJ 681, 17 (2008)
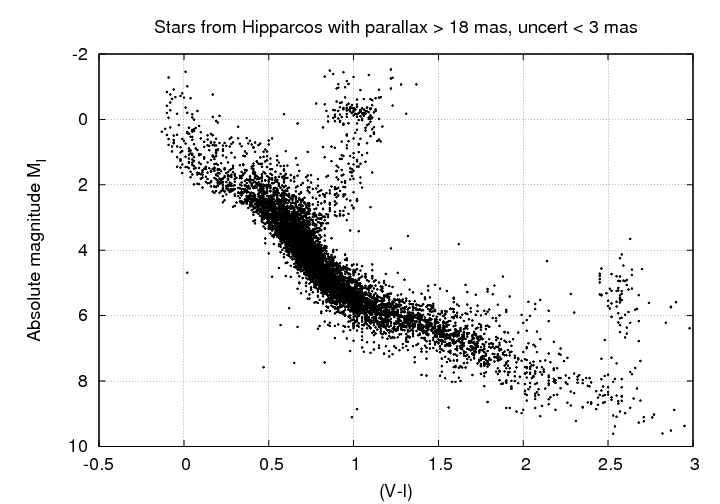
We can clearly see the red clump in this Hertzsprung-Russell diagram based on a subset of Hipparcos stars. Note the vertical scale: this graph shows absolute magnitude in the I-band, not the V-band.
We can use the following color-magnitude diagram, which also places I-band magnitudes on the vertical axis, to measure the distance to the LMC.
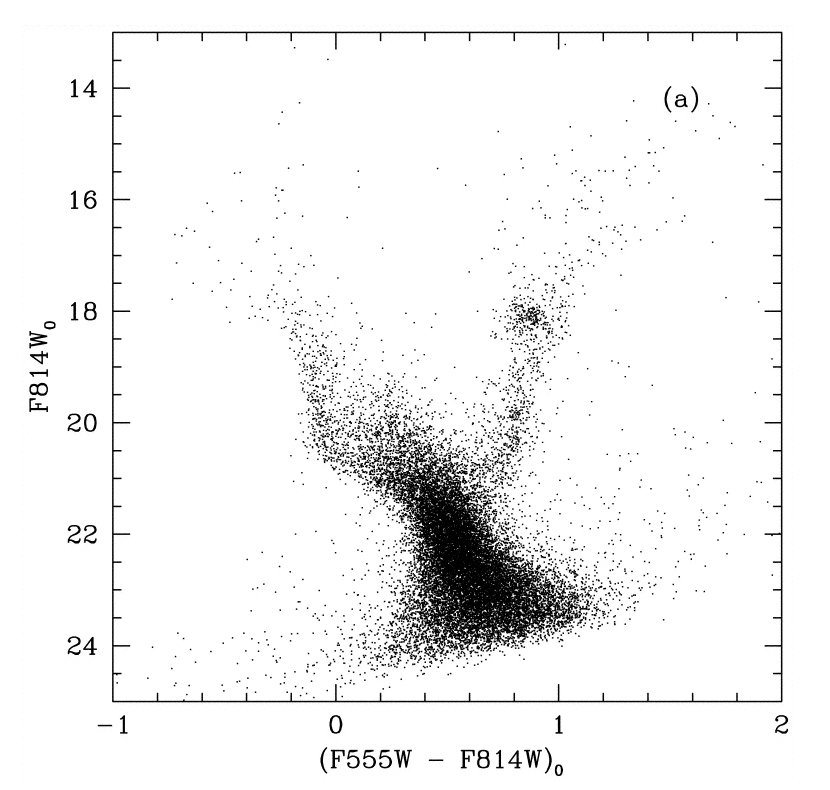
Figure taken from
Romaniello et al., ApJ 530, 738 (2000)
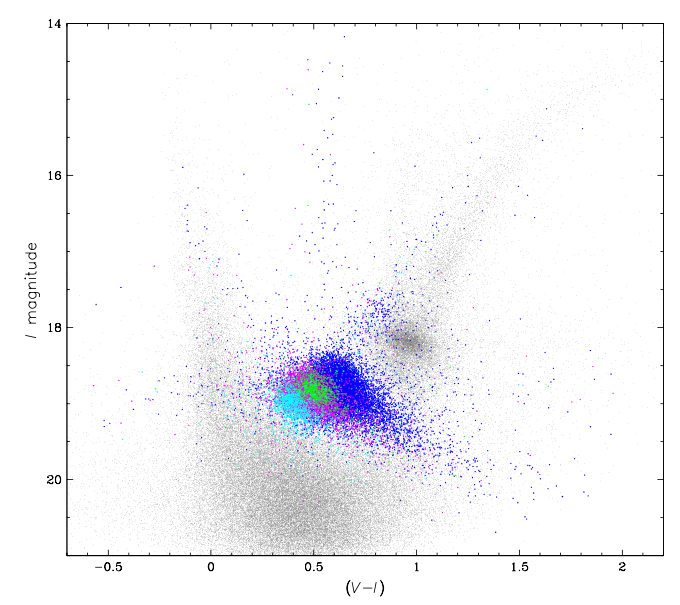
Figure taken from
Soszynski et al., Acta Astronomica 59, 1 (2009)
Recent work by Feast et al., MNRAS 386, 2115 (2008) finds that, using 142 RR Lyr stars in the Milky Way,
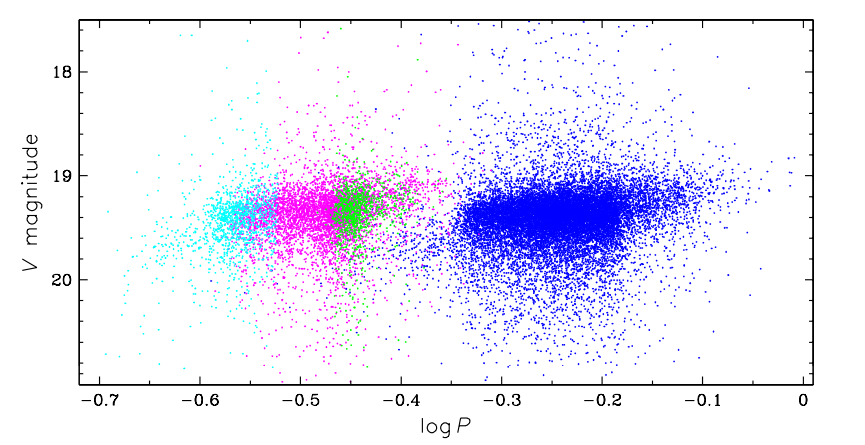
Figure taken from
Soszynski et al., Acta Astronomica 59, 1 (2009)
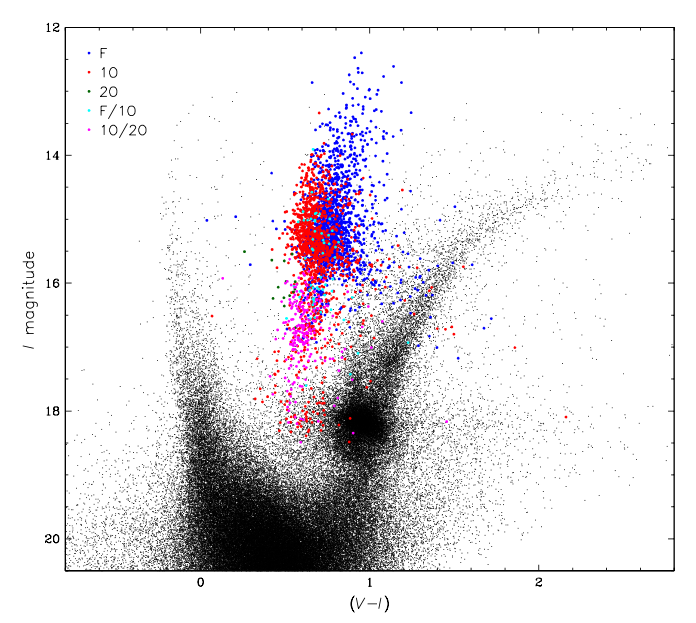
Figure taken from
Soszynski, Acta Astronomica 58, 163 (2008)

Figure taken from
Soszynski, Acta Astronomica 58, 163 (2008)
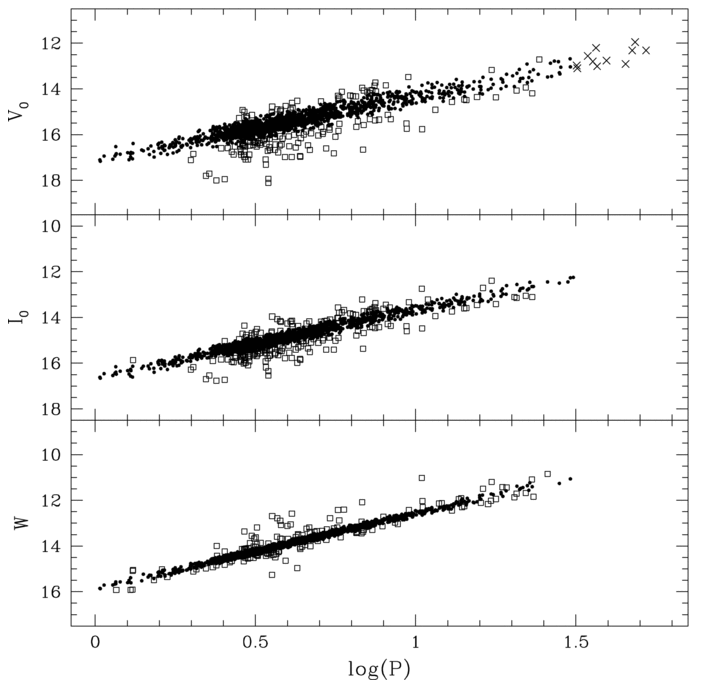
Figure taken from
Ngeow et al., ApJ 693, 691 (2009)
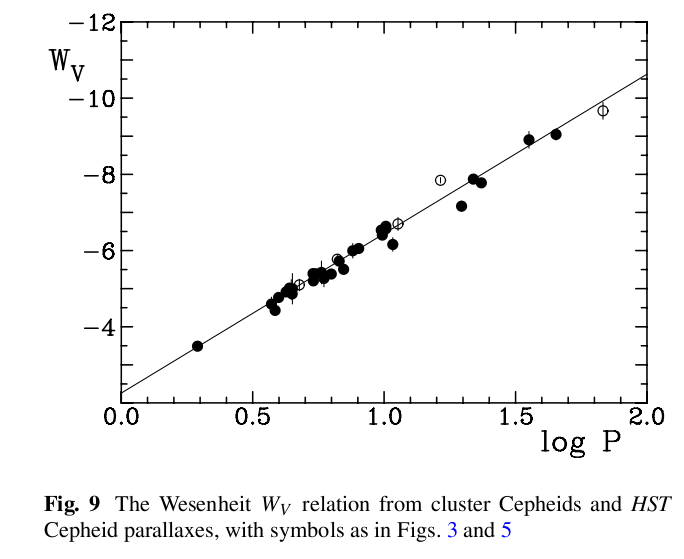
Figure taken from
Turner, ApSS 326, 219 (2010)
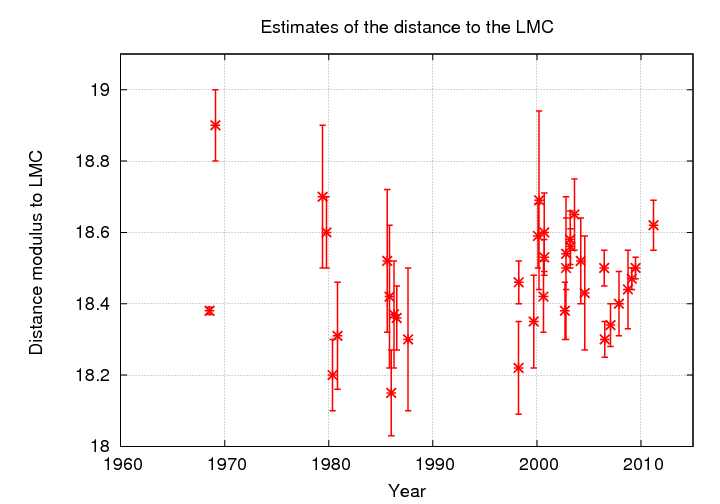
Do certain methods produce systematically larger or smaller distances? Let's find out.
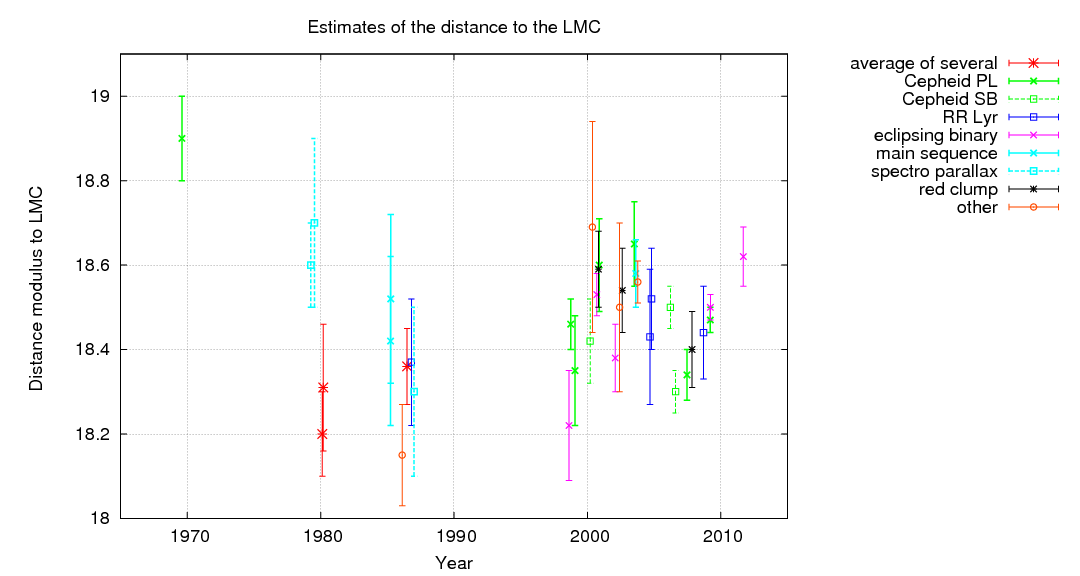
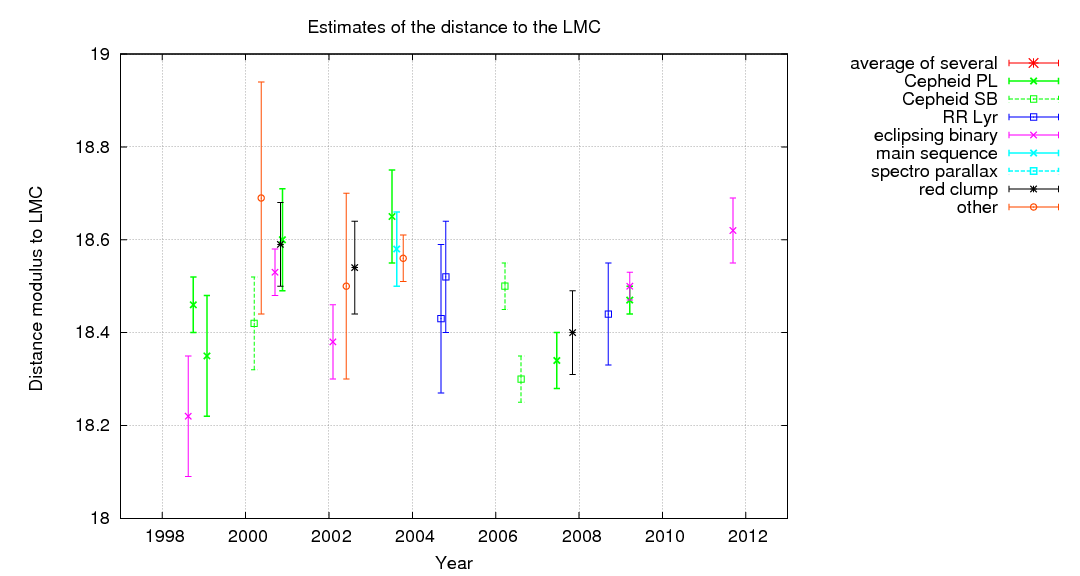
Let's zoom in on the past 15 years or so.
Copyright © Michael Richmond.
This work is licensed under a Creative Commons License.