 Copyright © Michael Richmond.
This work is licensed under a Creative Commons License.
Copyright © Michael Richmond.
This work is licensed under a Creative Commons License.
Let's start by taking a census of the galaxies in our Local Group. Actually, we'll just read a census taken by others.
The two most luminous members, by far, are the Milky Way and M31. Just as the Solar System could be described as "the Sun, Jupiter, and some dust", one might describe the Local Group as "two middling spiral galaxies and some dwarfs."
Let's consider three situations in which objects of different sizes and separations interact via gravitational forces.
The question at hand can be phrased several ways. One is "how important are the effects of SHAPE?" Another way to say it is "can one treat the objects as point masses?" Yet another phrasing is "will gravitational torques be significant?"
To address this question, we need to compare two quantities: the typical size of each object, and the typical separation. Let us define a quantity
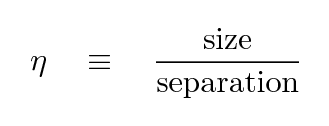
which is the ratio of size to separation. The larger the value of η, the more important it will be to include the effects of extended mass distribution when we consider gravitational interactions; in other words, the more significant gravitational torques and tides might be.
Can you fill in the table below?
  Body             Size        Separation       η
--------------------------------------------------------
  planet


  star


  galaxy


--------------------------------------------------------
What does this tell us? It tells us that
By the way, there is another -- easier, perhaps? -- way to grasp this notion. Just ask yourself --- what is the apparent angular size of a galaxy? a star? a planet?
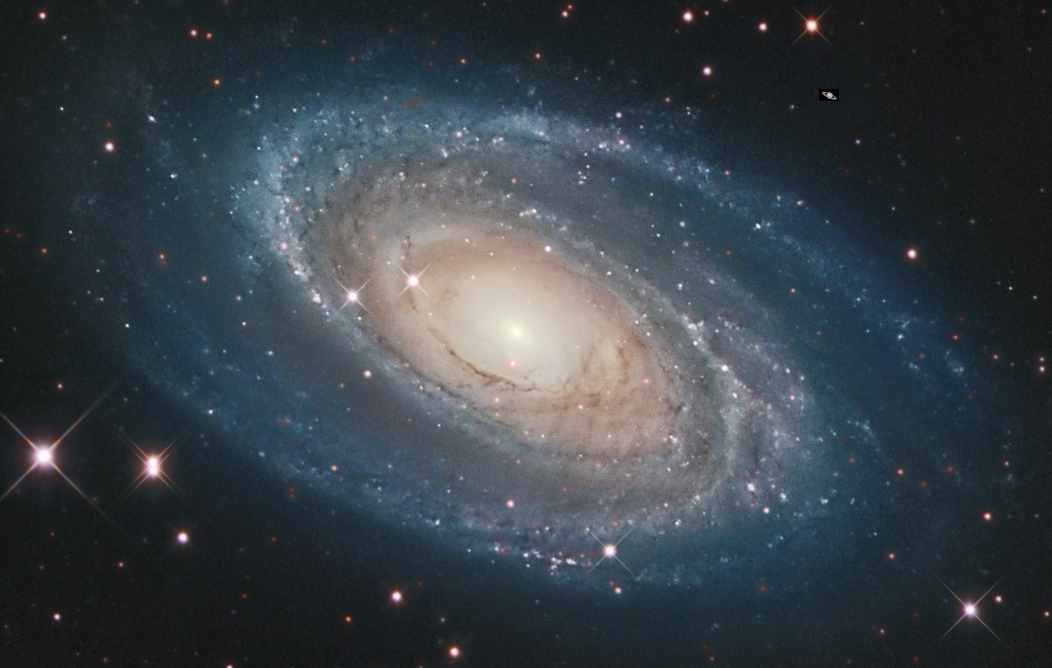
Image of M81 courtesy of
Giovanni Benintende
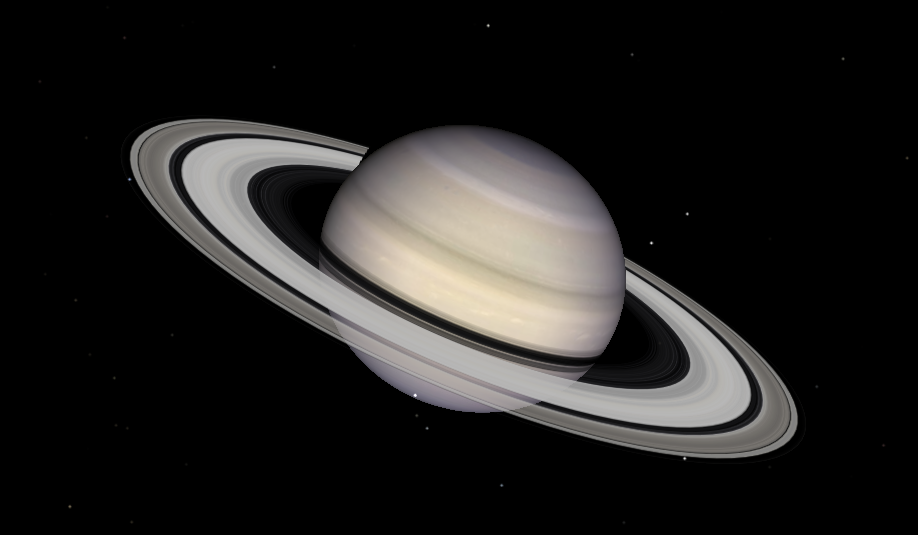
Image courtesy of
Celestia
The two largest and most massive members of the Local Group are the Milky Way and M31. Let's pretend that they are the only masses in the system, and use their motion to estimate the combined mass within the volume between them. We'll make several approximations: the two objects are isolated point masses, in a flat, static universe, with ordinary Newtonian gravity. The result might be called a "toy model", but it will illustrate the point well enough, and yield results which are within a factor of 2 or so of more sophisticated models.
What is the relative velocity of M31 and the Milky Way? Until just a few years ago, we only knew part of the answer: we could measure the radial velocity easily, but the transverse motion was too small to discern. But not any more!

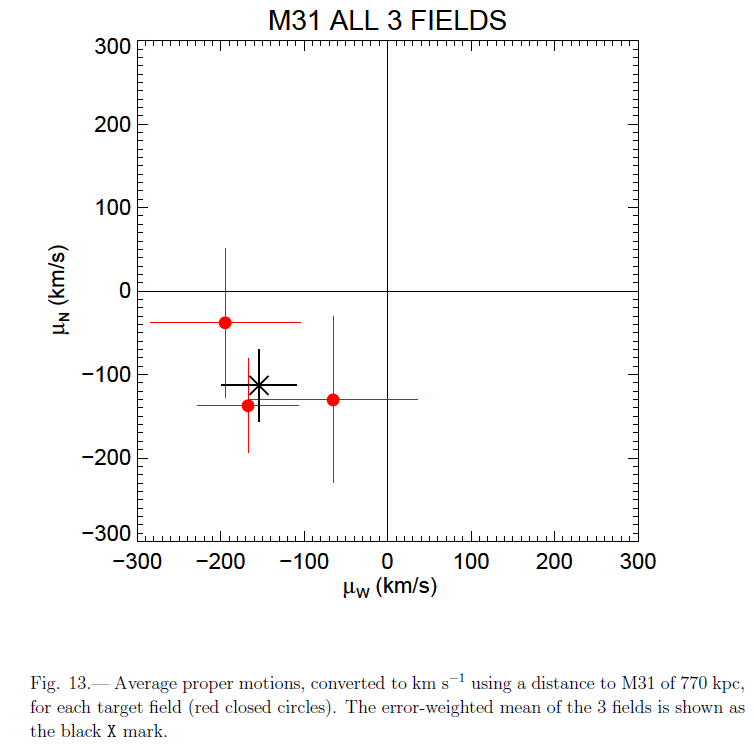
Recent measurements of the motion of stars in M31 against distant galaxies have allowed astronomers to compute the proper motion of M31 -- wow!
The measurements used HST images taken over a span of 5 to 7 years to discern teeny-tiny motions of the stars in M31 relative to background galaxies. The results of painstaking analysis ...
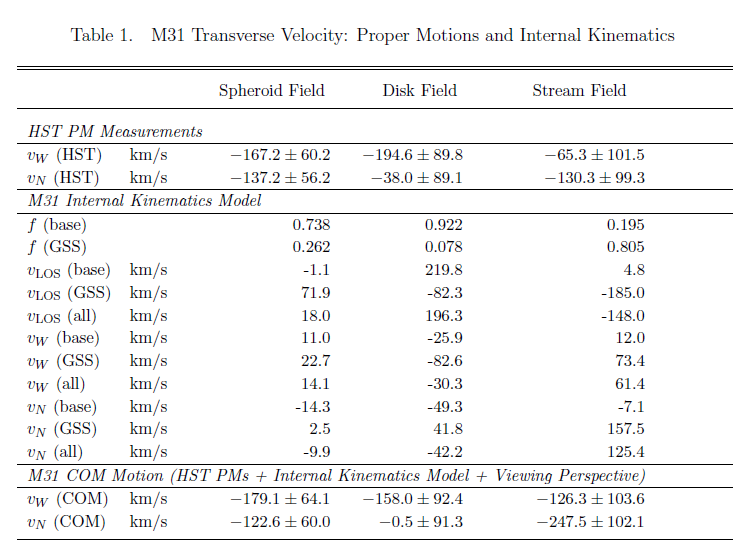
... can be summarized in a single graph, which shows the velocity of M31 relative to the Sun:
But wait -- we can use the motions of other objects in the Local Group to improve our estimate of M31's motion.
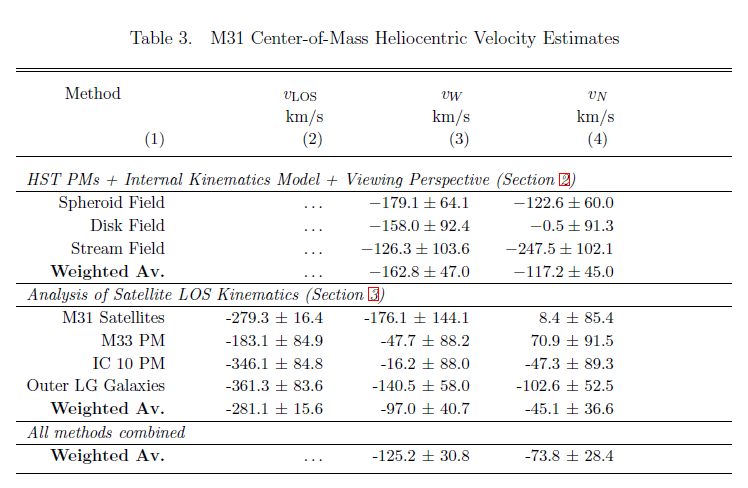
But it turns out that when one corrects for the motion of the Sun within the Milky Way, one finds that the transverse velocity of the center of mass of M31 relative to the center of mass of the Milky Way is very small: only about 17 km/sec.

If we suppose that M31 and the Milky Way were originally formed in reasonably close proximity, then we might conclude that the two objects initially separated, reaching some maximum separation at some point in the past, but, due to the their mutual gravitational force, are now accelerating toward each other. In other words, we might assume that the combined mass of the two galaxies is large enough to bind them to each other gravitationally. In that case, we could run the arrow of time backwards and watch M31 move AWAY from the Milky Way, slow down, reach the maximum separation, and then approach again.
The known age of the universe -- about 14 billion years -- places a bound on the time over which this entire trajectory can occur. With our simple toy model,
we can apply Kepler's Laws or a simple numerical integration to chart the motion of the two galaxies as a function of time in the past.
- the two objects are isolated point masses,
- in a flat, static universe,
- with ordinary Newtonian gravity.
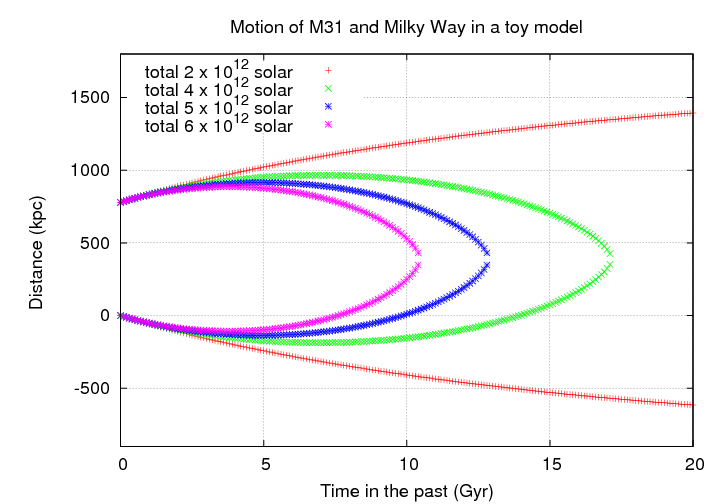
The toy model suggests that the combined mass of the two big spiral galaxies is around 5 x 10¹² solar masses. That's a bit larger than estimates made under more realistic conditions, which tend to yield values in the range 3-4 x 10¹² solar masses. Either way, the total mass is far larger than we would conclude based on the visible material in each galaxy, and it's larger than the mass we measure based on the motions of stars within the Milky Way itself, or of satellite galaxies around the Milky Way.
van der Marel et al. conclude that the masses of both the Milky Way and M31 are both of order 2 x 10¹² solar.

          Use the mass of the Milky Way from the Figure above
          plus the absolute magnitudes in B-band of

             Sun:         MB =   5.5
             Milky Way:   MB = -20.2

          to compute the mass-to-light ratio of the
          Milky Way Galaxy, in B-band, in solar units.
The majority of galaxies in the universe a relatively small and weak, much less luminous than the big spirals like M31 and the Milky Way. Because they emit so little light, we can barely detect them in the nearest big clusters (Virgo and Coma); beyond that, they grow completely invisible. Our only chance to study them in depth is provided by the Local Group, which contains several dozen of these common yet obscure galaxies.
For example, consider the luminosity function of galaxies. Here's a view of the data and a Schechter function fit to tens of thousands of galaxies measured by the SDSS.
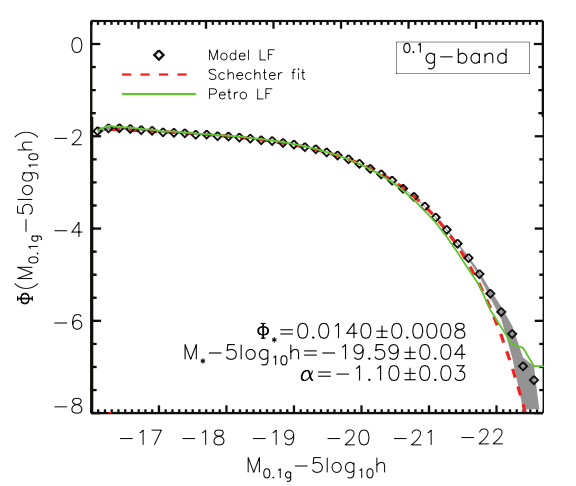
Figure taken from (and reversed)
Montaro-Dorta and Prado, MNRAS 399, 1106 (2009)
Looks pretty impressive, doesn't it? But how well does it describe the galaxies we can see in our Local Group?
    Q:  How many of the galaxies in our Local Group
        would fit on the above graph?


        How many would not fit?
I used the list at Mike Irwin's web site to create a very limited sort of luminosity function, and shifted it vertically so that it would lie on top of the SDSS version. The red line is solid over the range covered in Montaro-Dorta and Prado, MNRAS 399, 1106 (2009) ; the dashed red line is a simple extrapolation of the Schechter function to lower luminosities.
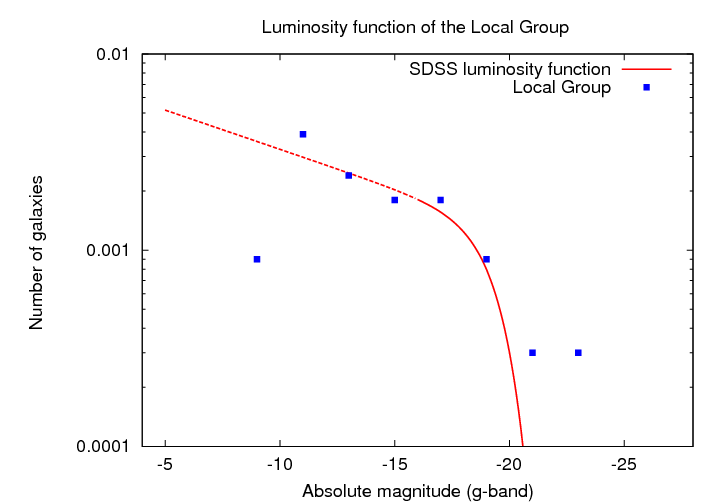
   Q:   Is the Local Group a good representative
        sample of the SDSS luminosity function?


   Q:   Is the SDSS luminosity function a good
        representative of the universe at large?
Because galaxies are so relatively close to each other for their size, they ought to interact frequently. If we look carefully, we can find plenty of examples of what appear to be galaxies in some sort of collision.
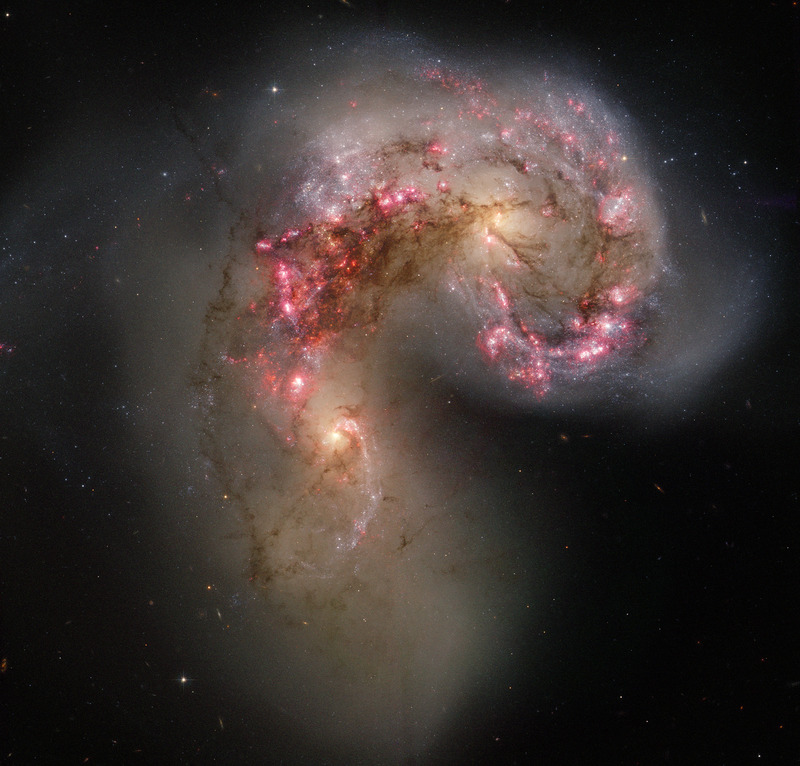
Image courtesy of
NASA, ESA & B. Whitmore (STScI) et al.; Image processing: Davide De Martin

Image courtesy of
NASA, ESA and A. Evans (Stony Brook) et al.
However, the details of the interaction are hard to discern in this distant galaxies. Moreover, we can only see the collisions of giant galaxies; interactions between giants and dwarfs, which must be much, much more common, are just too subtle.
On the other hand, here in the Local Group, we can detect collisions even long after they have occurred. Consider the Sagittarius Dwarf galaxy. It was first detected, not in a picture, but in a graph of stellar motions:
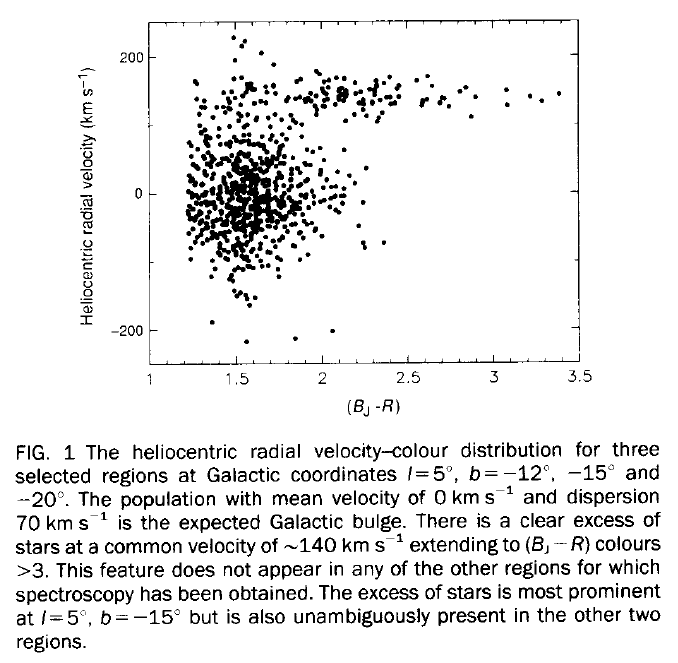
Figure taken from
Ibata, Gilmore and Irwin (Nature, 370, 194, 1994)
We can't really see this galaxy as a coherent units of stars on the sky for two reasons. First, the density of stars in the Sgr dwarf is small; and second, it happens to be passing behind the center of the Milky Way right now.
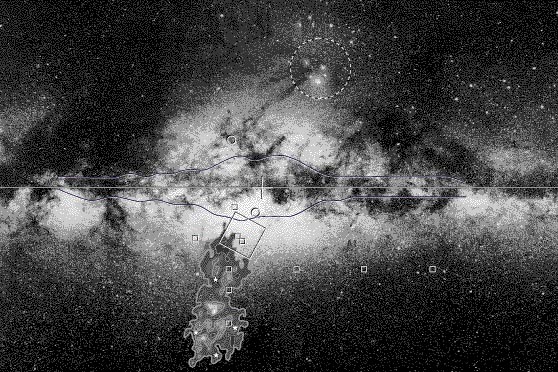
Image courtesy of
R. Ibata (UBC), R. Wyse (JHU), R. Sword (IoA)
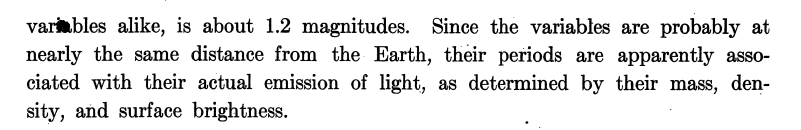
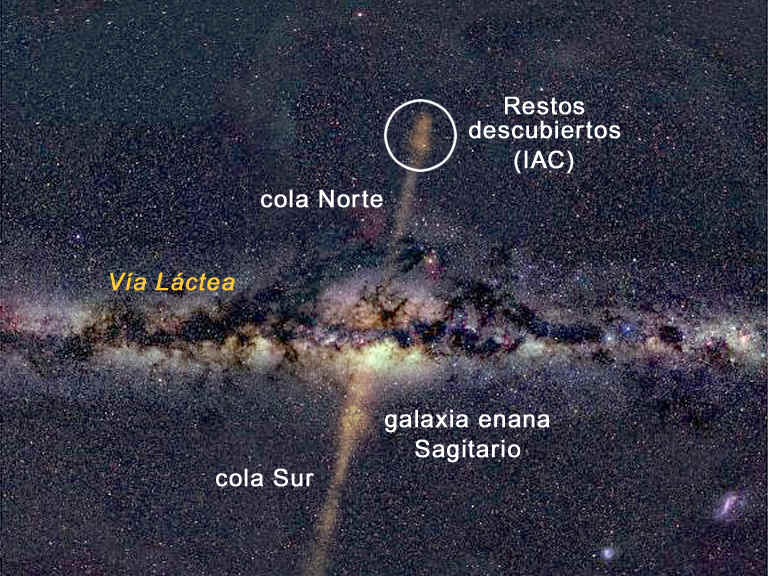
You can see a version in Spanish, if you prefer
By noting the colors and velocities of the stars in the galaxy, astronomers have been able to trace the trail of stars it has left behind in its orbit around (and through!) the Milky Way:
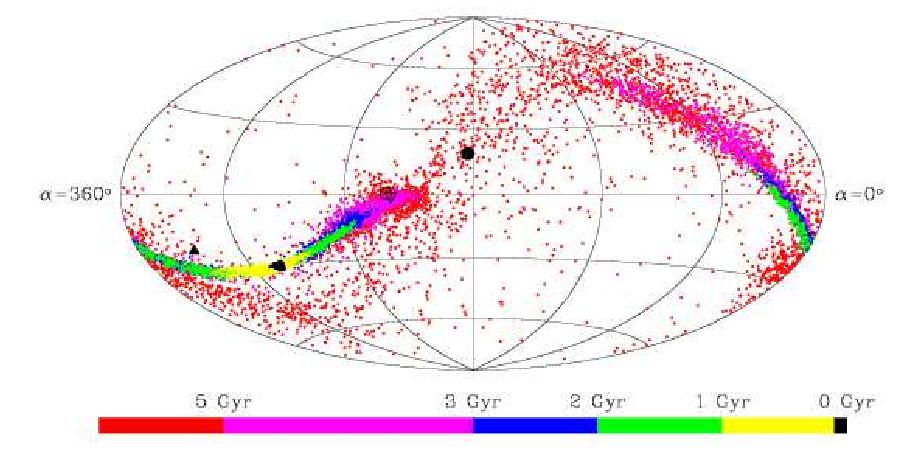
Image taken from
Martinez-Delgado et al., ApJ 601, 242 (2004)
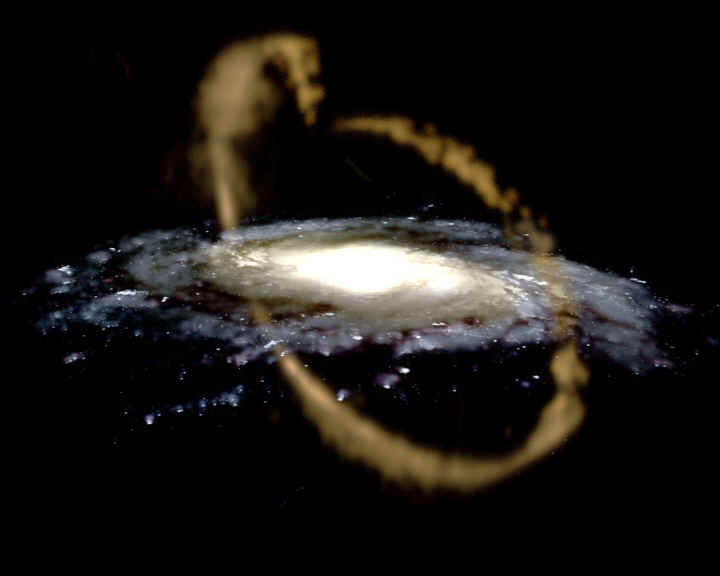
Image courtesy of
Canibalismo Galáctico
The interactions of this (and other) satellites with our Milky Way reveal details of the gravitational potential of our galaxy that would otherwise be hard to measure. They also tell us that a portion of the Milky Way's halo must be the remnants of other encounters with satellite galaxies in the distant past.
The whitish blobs and streaks on these maps of the Milky Way's halo indicate overdensities of objects, the signs of satellite galaxies and residual streams. Bell et al. (ApJ 680, 295, 2008) use measurements from the SDSS to argue that
... We compared the observations with simulations of galactic stellar halos formed entirely from the accretion of satellites in a cosmological context by analyzing the simulations in the same way as the SDSS data. While the masses, overall profiles, and degree of substructure in the simulated stellar halos show considerable scatter, the properties and degree of substructure in the Milky Way's halo match well the properties of a "typical" stellar halo built exclusively out of the debris from disrupted satellite galaxies. Our results therefore point toward a picture in which an important fraction of the stellar halo of the Milky Way has been accreted from satellite galaxies.
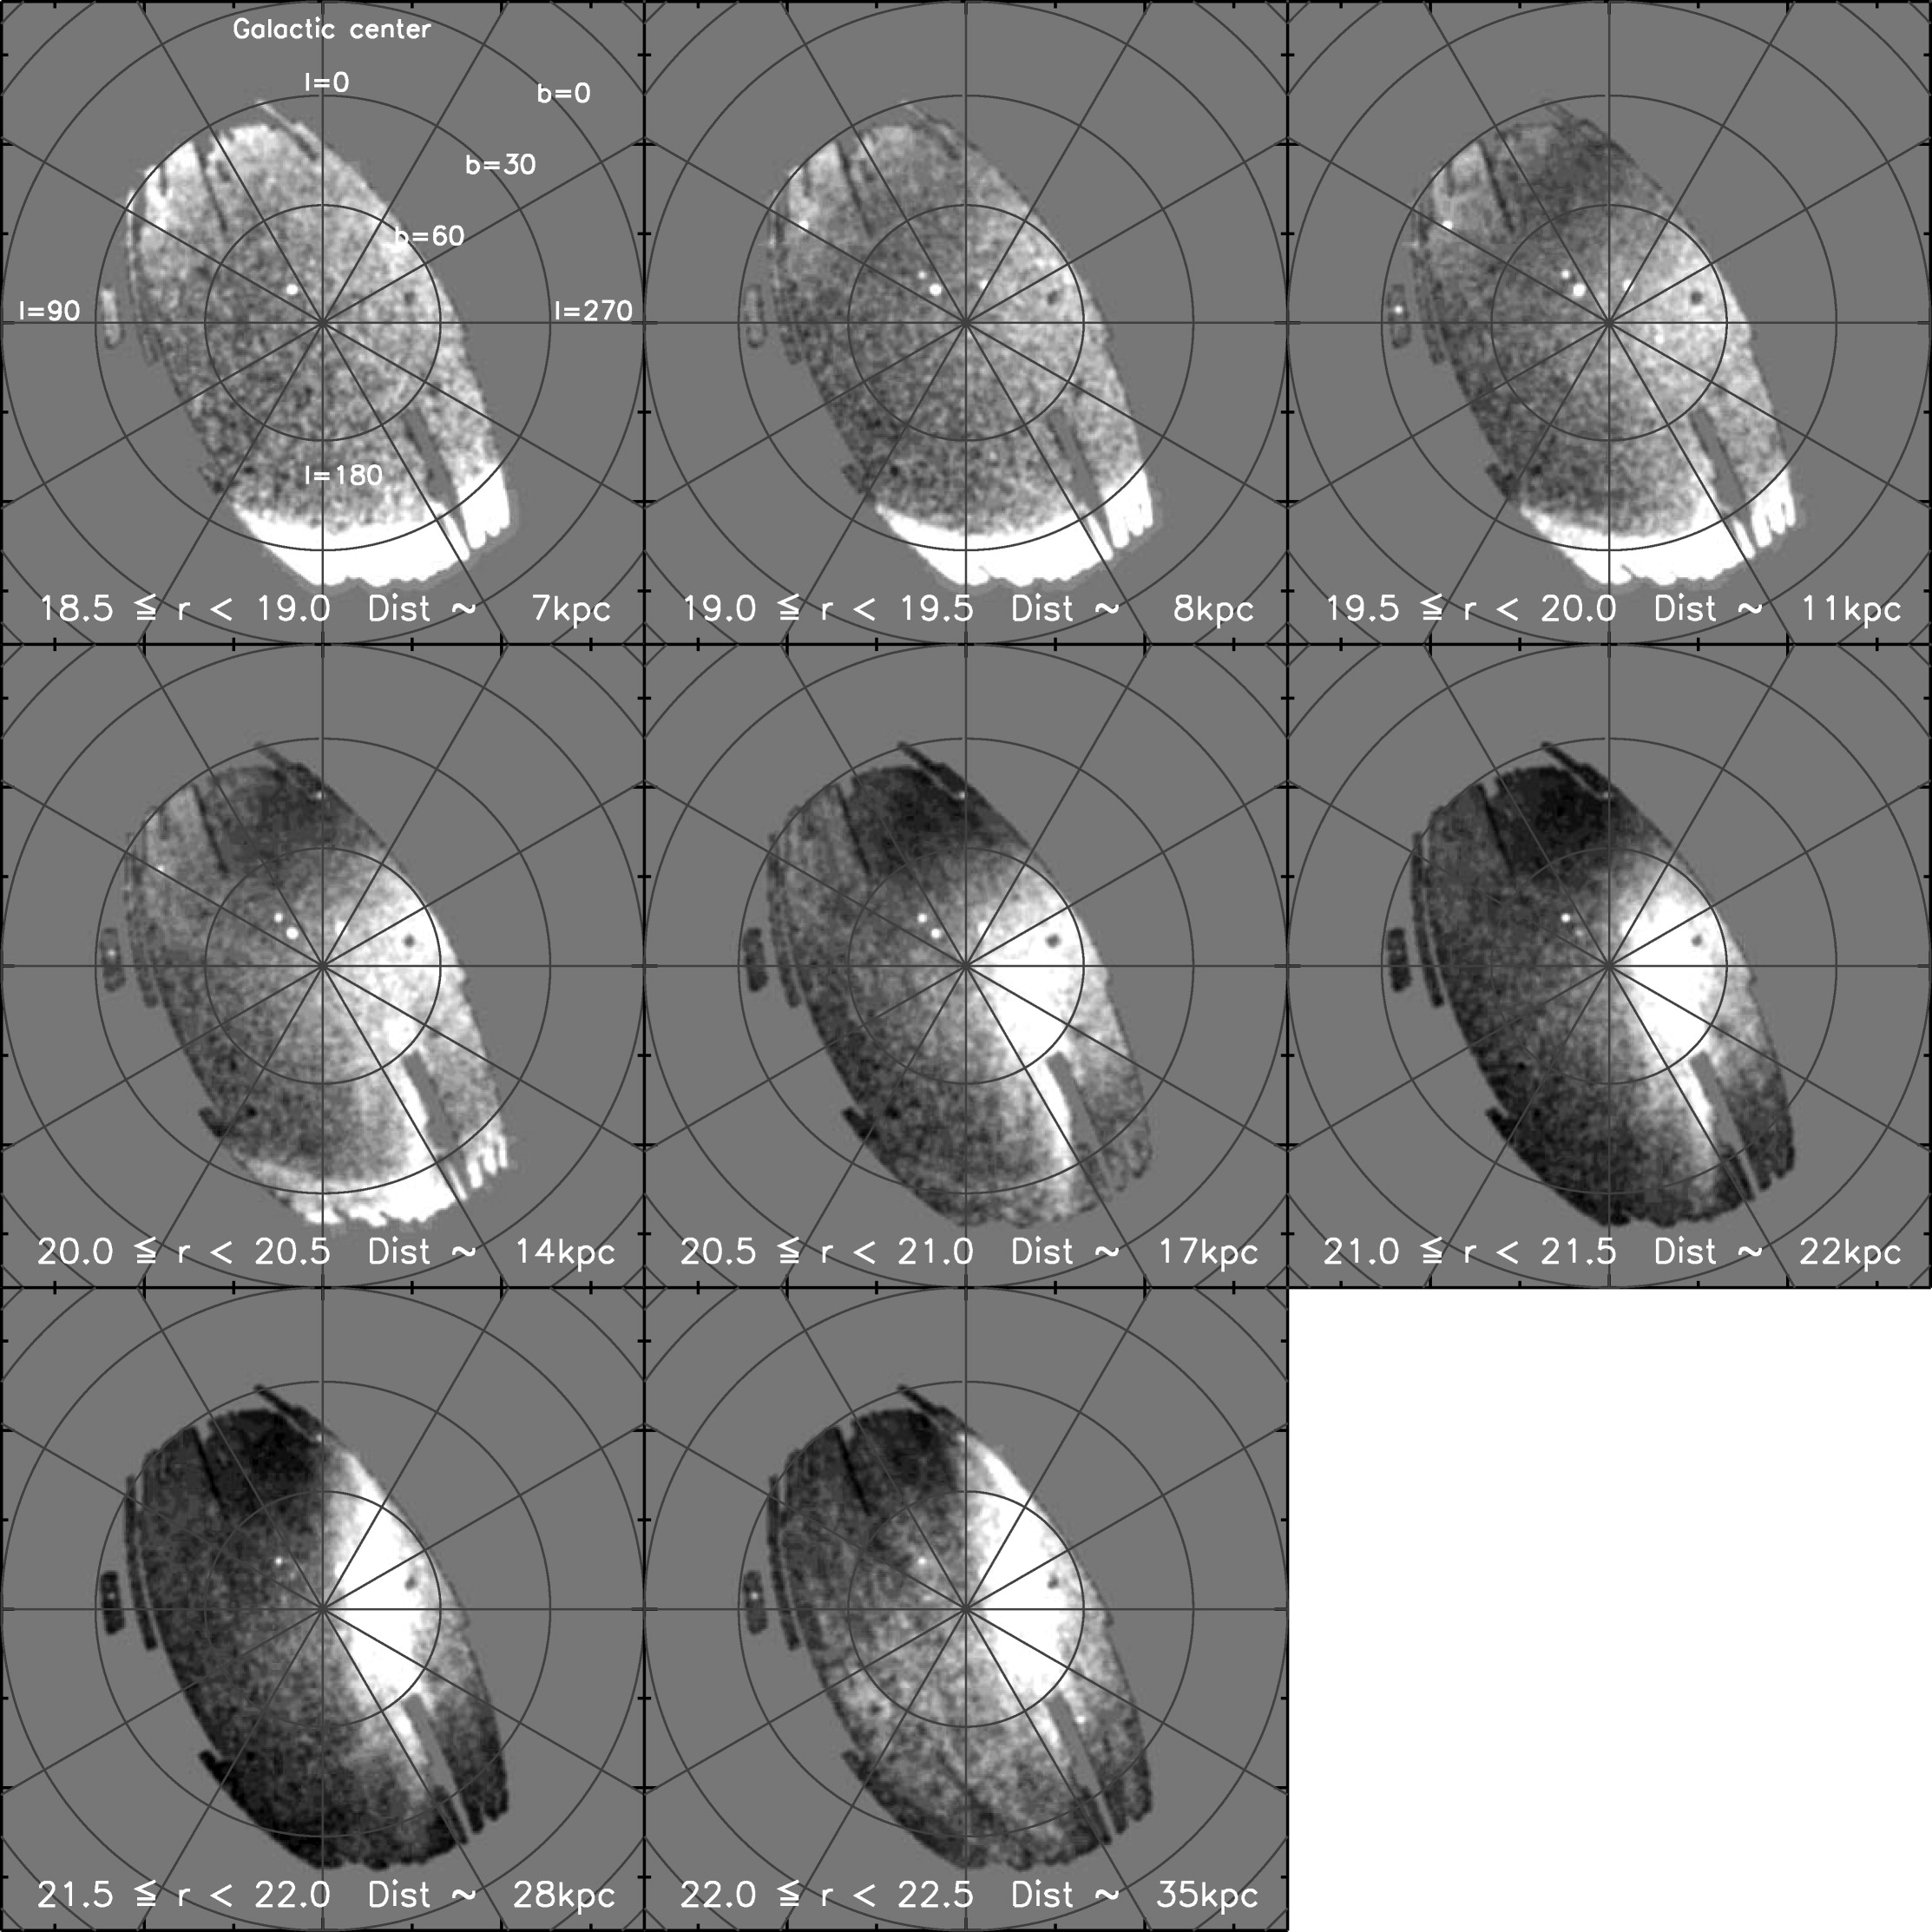
Figure taken from
Bell et al., ApJ 680, 295 (2008)
Members of the Local Group -- and one in particular -- serve a very important purpose: they provide us with samples of astrophysical sources which are
We can study these sources within the Local Group, but then apply what we have learned to similar sources in much more distant galaxies.
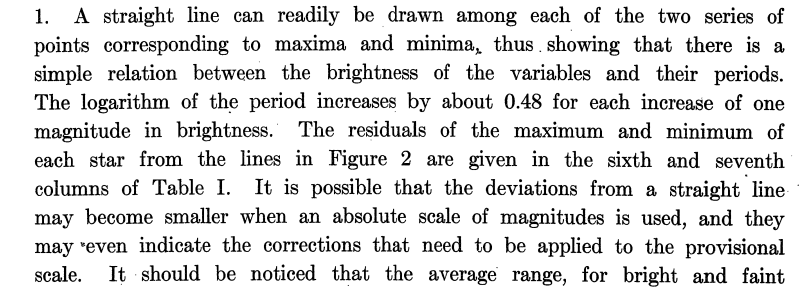
Consider, for example, the Cepheid variable stars. By the turn of the twentieth century, astronomers knew of many examples of this sort of pulsating star in our own Milky Way, but there seemed to be nothing special about them; just another of the many, many types of variable star. In the early 1900s, however, an astronomer at the Harvard College Observatory noticed something peculiar about the Cepheid variables which she was measuring in the Small Magellanic Cloud: a relationship between the period of variation (horizontal axis) and the magnitude of the star (vertical axis). The upper curve in each figure is the magnitude at maximum light, and the lower the magnitude at minimum light.
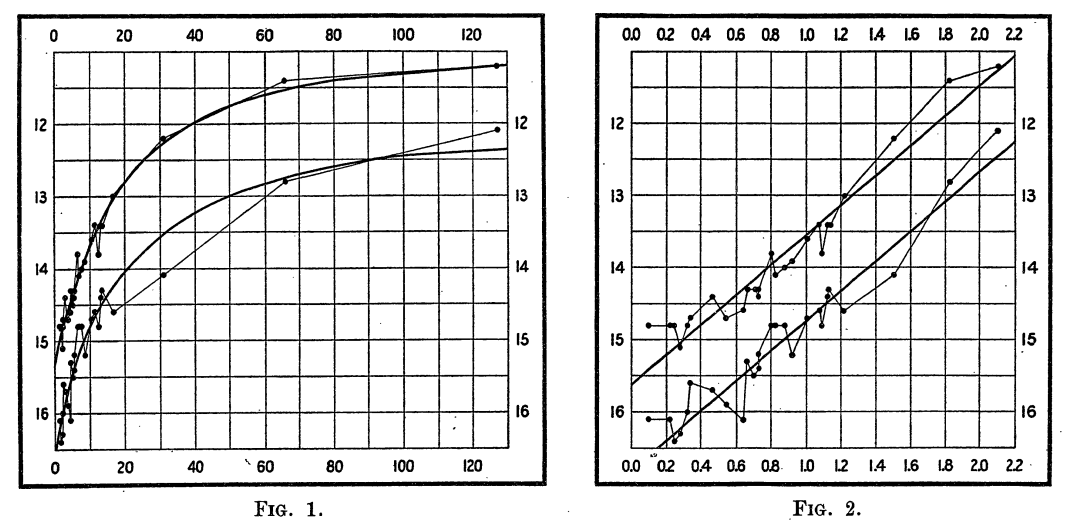
Figure taken from
Pickering (and Leavitt), Harvard Circular 173, 1 (1912)
Because all the objects in a Local Group galaxy are at (almost) the same distance from us, their apparent magnitudes can stand in for their absolute magnitudes in many ways. This makes teasing out the properties of different classes of objects much, much simpler than the usual situation of comparing objects at different distances.
The Large Magellanic Cloud, in particular, has become THE standard stepping stone for this sort of work. Why?
  Galaxy       Distance      Distance modulus     apparent magnitude
                                                   of a Sun-like star
  --------------------------------------------------------------------

   LMC           50 kpc


   M31          770 kpc

  --------------------------------------------------------------------
On the other hand, it's not an perfect example of a calibration source. The main drawback is its metallicity: stars in the LMC have a much smaller amount -- by factors of 10 to 100 -- of the heavy elements such as carbon, oxygen and iron, compared to hydrogen. That means that when we compare stars in the LMC to stars in the Milky Way (or many other distant galaxies), we need to make metallicity corrections to the properties of the sources.
Copyright © Michael Richmond.
This work is licensed under a Creative Commons License.