 Copyright © Michael Richmond.
This work is licensed under a Creative Commons License.
Copyright © Michael Richmond.
This work is licensed under a Creative Commons License.
We can use observations of quasars at high redshift to measure the abundance of deuterium relative to ordinary hydrogen. One good example was published recently:
Let's look at the method and the results.
Start with the spectrum of a quasar. The features we will see are produced in the ultraviolet, but, since this quasar is at redshift z = 3, they are shifted into the optical portion of the spectrum. How convenient! Note the very high signal-to-noise ratio, which is a product of
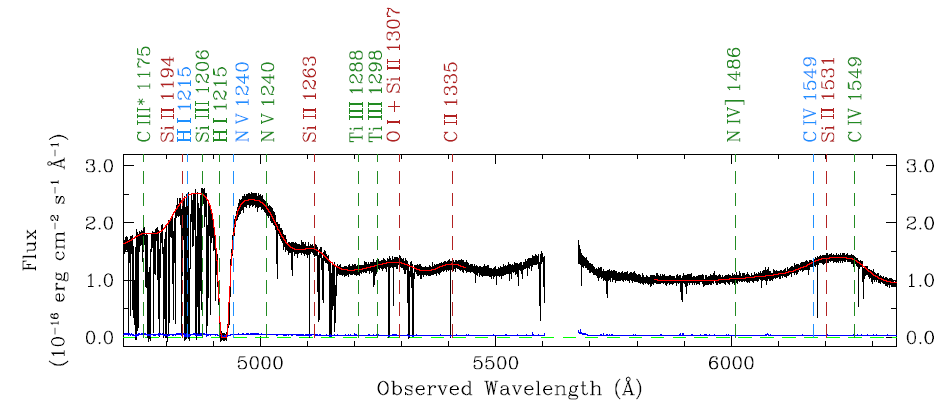
Figure 2 from
Pettini and Cooke, MNRAS 425, 2477 (2012).
If we look at the region around Lyman-alpha, we see a big absorption line from material around the quasar itself, plus a bunch of lines due to absorption by galaxies and clouds of gas between us and the quasar.
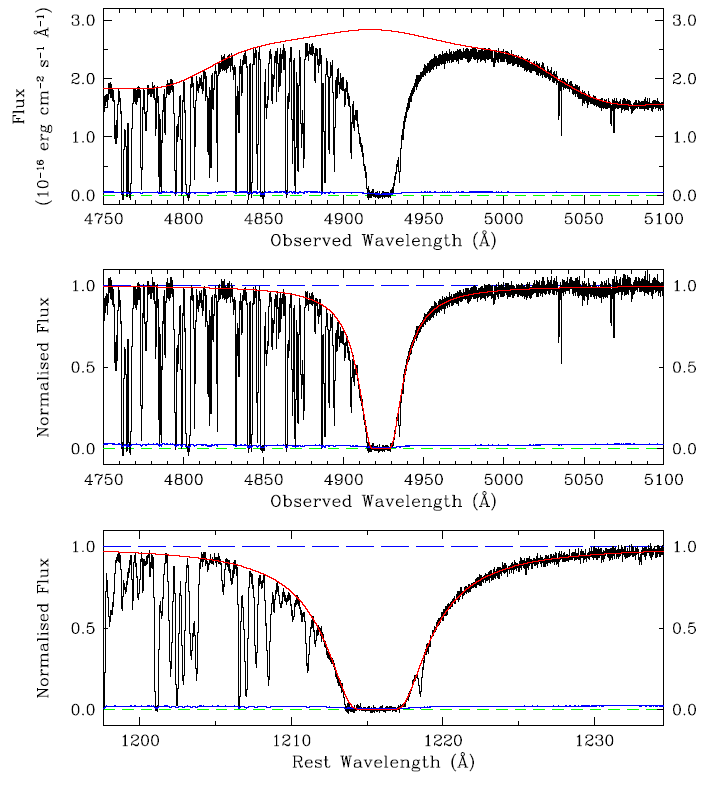
Figure 3 from
Pettini and Cooke, MNRAS 425, 2477 (2012).
There's not much we can learn from this very heavily saturated Lyman-alpha line. But we can use it to measure the redshift of the absorbing material: z = 3.04984. Now, if we look at wavelengths which correspond to other transitions at the same redshift, we see something very interesting:

Figure 4 from
Pettini and Cooke, MNRAS 425, 2477 (2012).
There are two absorption lines at most of these wavelengths: a strong one, due to ordinary hydrogen, and a weaker one, due to the less-common deuterium. Fewer atomes of deuterium mean fewer photons absorbed by it.
The authors use measurements of the relative strengths of the absorption lines to compute the relative abundance of deuterium and ordinary hydrogen. You can see their result:
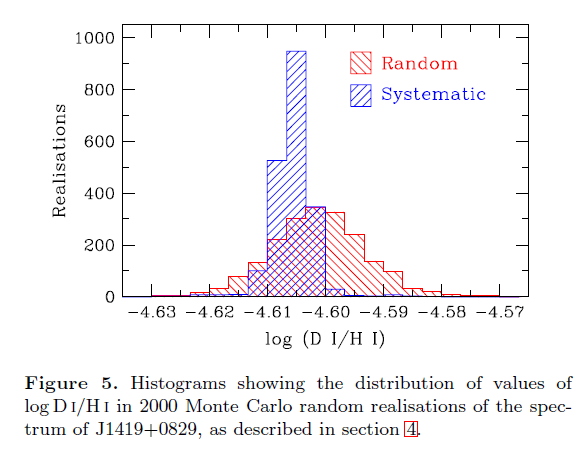
Figure 5 from
Pettini and Cooke, MNRAS 425, 2477 (2012).
Copyright © Michael Richmond.
This work is licensed under a Creative Commons License.