 Copyright © Michael Richmond.
This work is licensed under a Creative Commons License.
Copyright © Michael Richmond.
This work is licensed under a Creative Commons License.
Let's look at the gross properties of galaxies from several different points of view. As you'll see, they often seem to split up into distinct groups, which correspond pretty well to the simple split between spirals and ellipticals.
One of the simplest ways to classify galaxies is to measure their colors: just add up all the light in two different passbands and compare the magnitudes in each. For small, distant, and faint objects, this may be one of the few practical measurements.
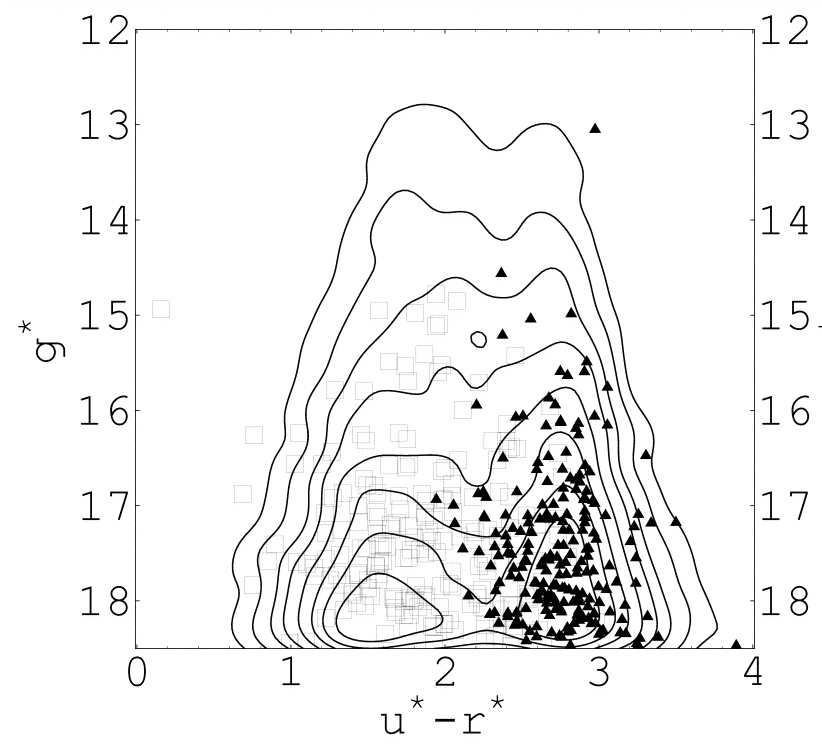
A good reference for this sort of work is Strateva et al. AJ 122, 1861 (2001) , which used a set of almost 150,000 galaxies measured with the SDSS. The authors find that galaxies naturally fall into two groups based on optical colors. Moreover, the two groups -- based on colors -- are almost the same as the groups one would find based on spectral type (early = triangle, late = squares) ...
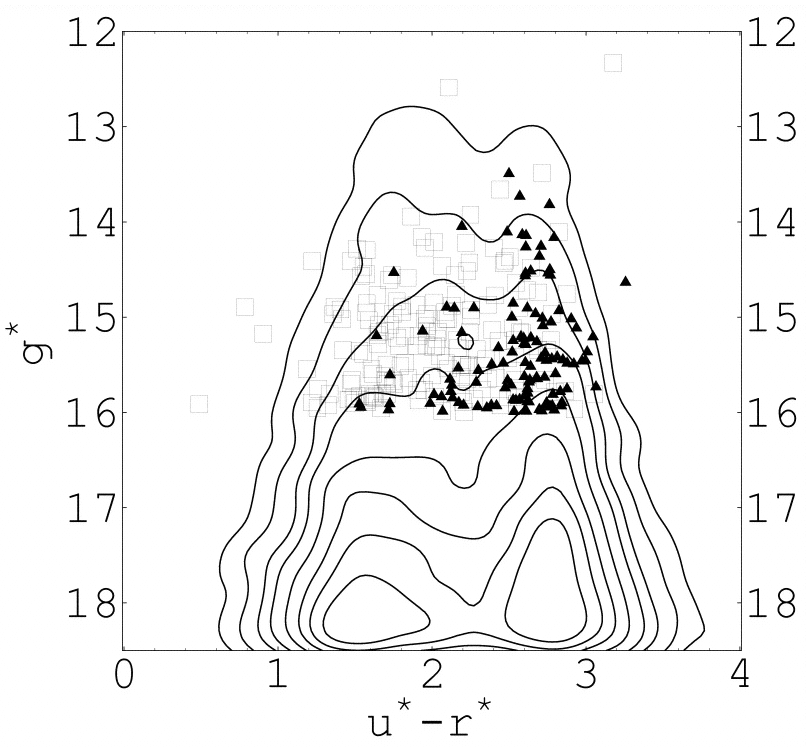
.... and the same as one would find based on morphology (again, early = triangle, late = squares).
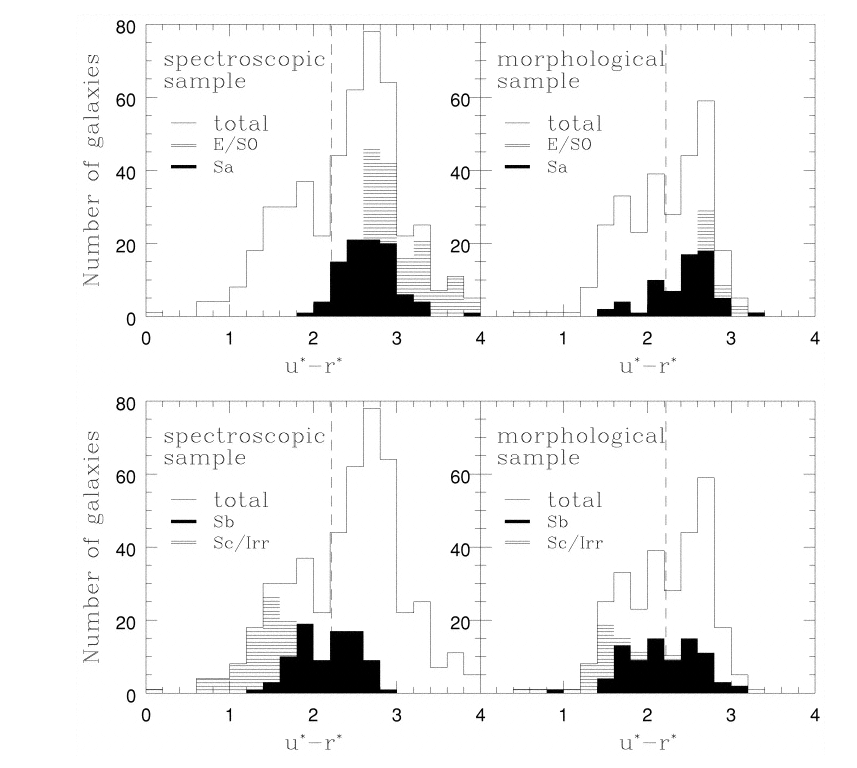
Here's a more detailed breakdown of the galaxies by their morphological type; again, note how well morphology agrees with color.
Remember concentration index? Well, the degree to which light is concentrated in the center also correlates well with overall color.
Of course, a VERY simple way to check this connection between color and galaxy type is to look at a big picture full of galaxies and see which ones are red and which ones are blue.
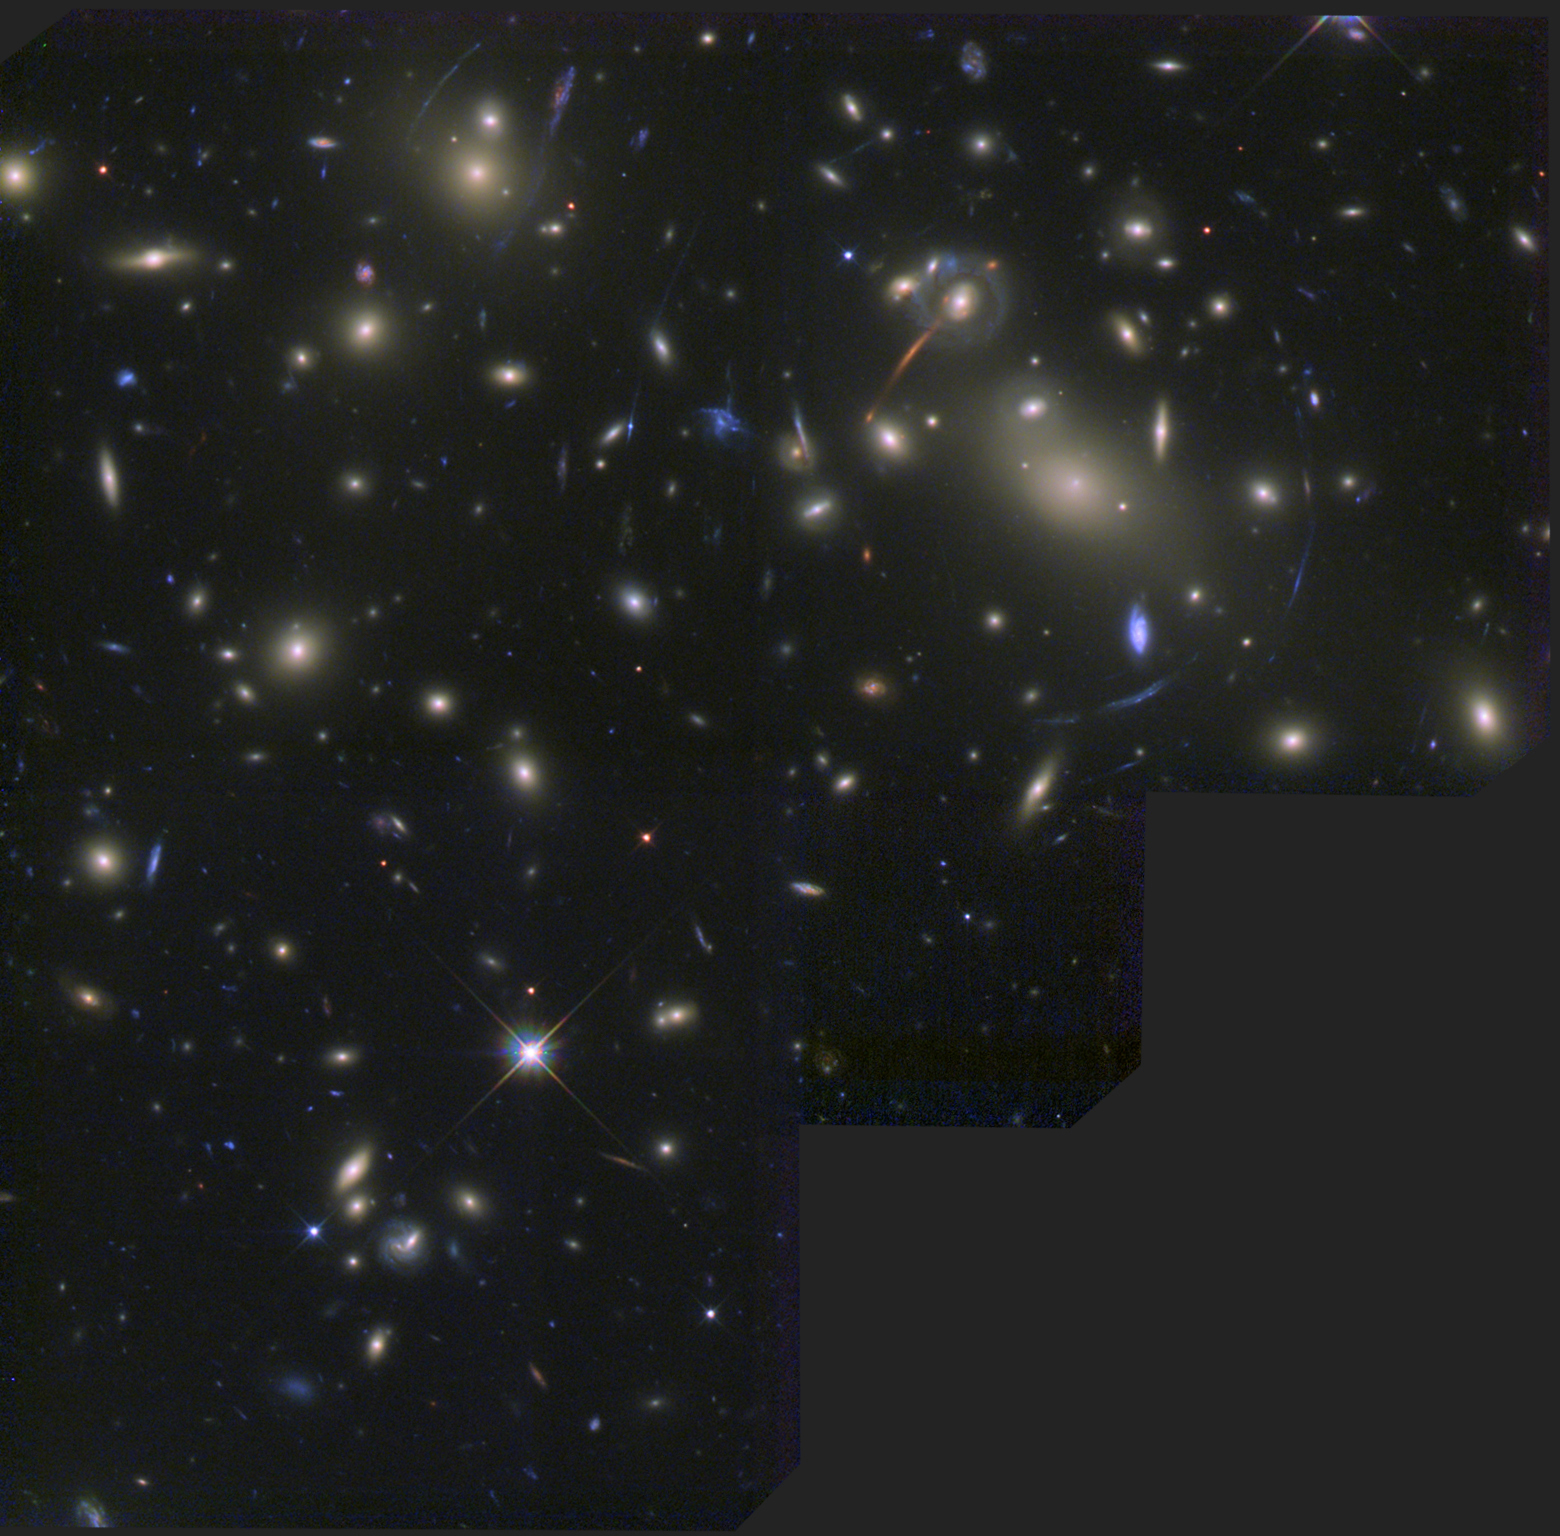
Image of Abell 2218 courtesy of
Andy Fruchter ,
STScI ,
WFPC/2 ,
HST ,
NASA ,
and
Al Kelly.
Speaking of colors, you may hear the term red ridge when someone is discussing clusters of galaxies. As we will see, rich clusters of galaxies have large populations of ellipticals, and the colors of these ellipticals tend to be the same for both high- and low-luminosity members. So, if you happen to make a graph showing color as a function of magnitude, you might see a pattern like this:
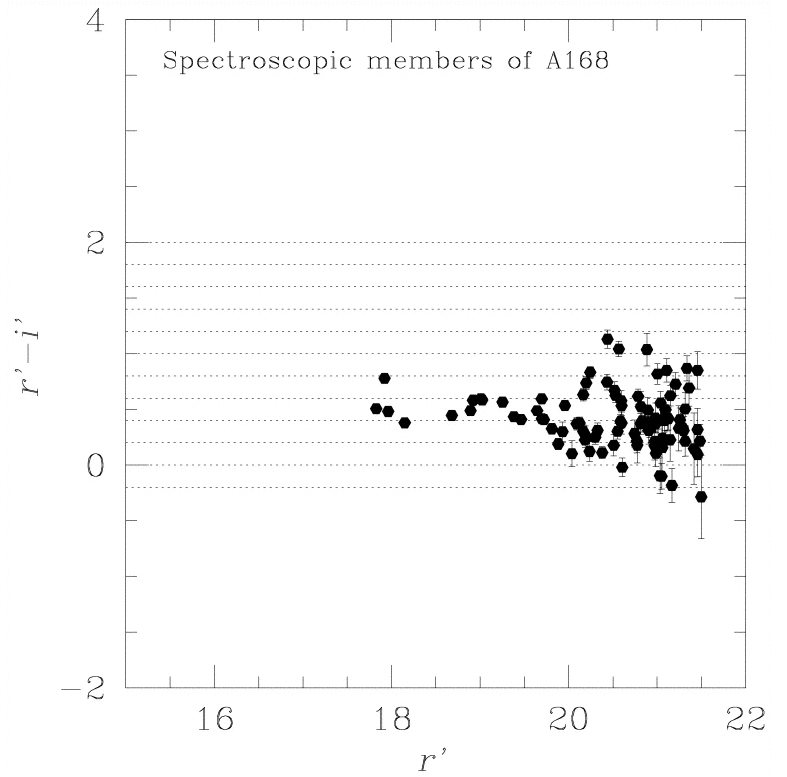
Graph taken from
Goto et al. AJ, 123, 1807 (2002)
Why is it that early-type galaxies have different colors than late-type galaxies?
Q: Why are the colors different?
So, below are two sample spectra. Can you tell which one belongs to an early-type galaxy, and which to a late-type galaxy?
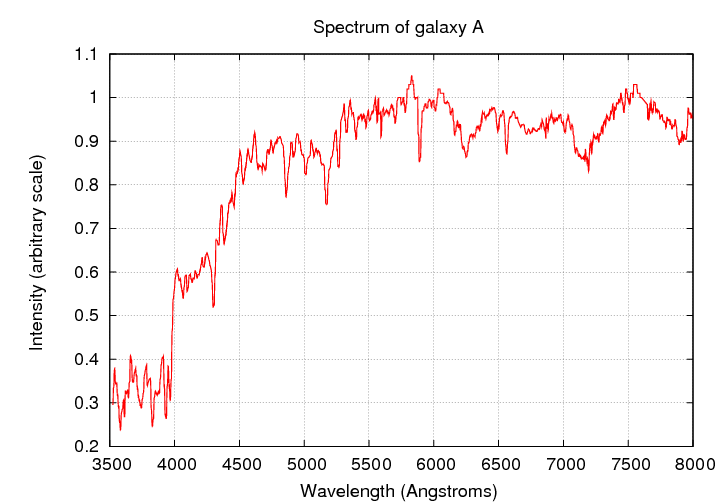
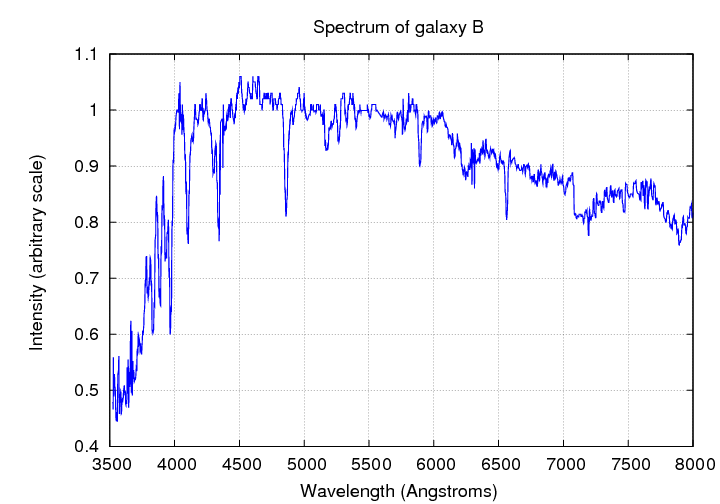
  Q:  What is the type of galaxy A?

      What is the type of galaxy B?
When I hear the word "galaxy", I think of a big whitish ball of stars; after all, that's what one typically sees when one takes a picture. In the optical, stars emit most of the radiation from (most) galaxies.
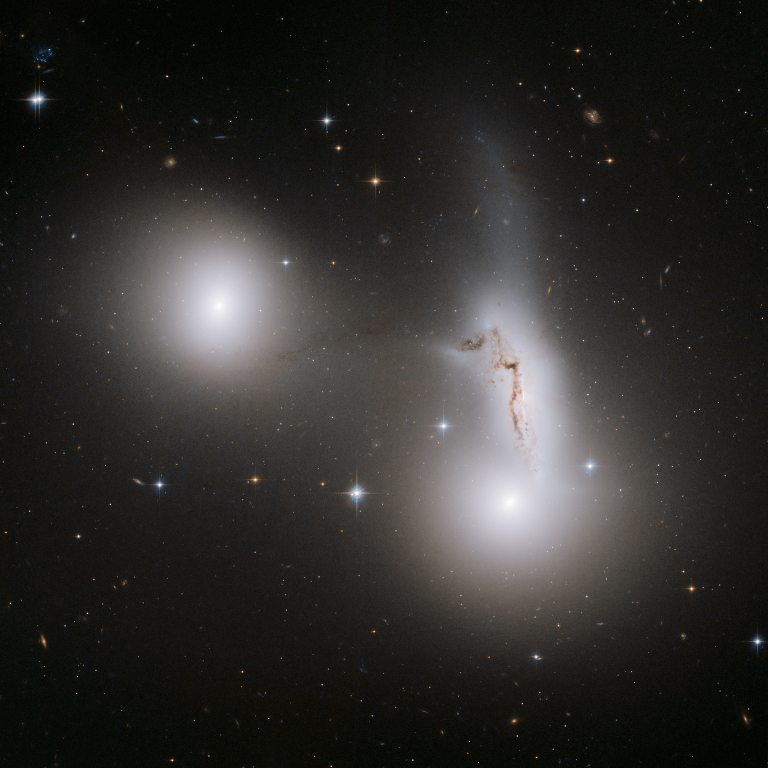
Image of Hickson group 90 courtesy of
NASA ,
ESA ,
R. Sharples
and
Astronomy Picture of the Day
But galaxies change their appearance drastically when observed at different wavelengths. Notice the change as one moves over the relatively small range from near-UV to near-IR: this is just a matter of emphasizing different populations of stars.
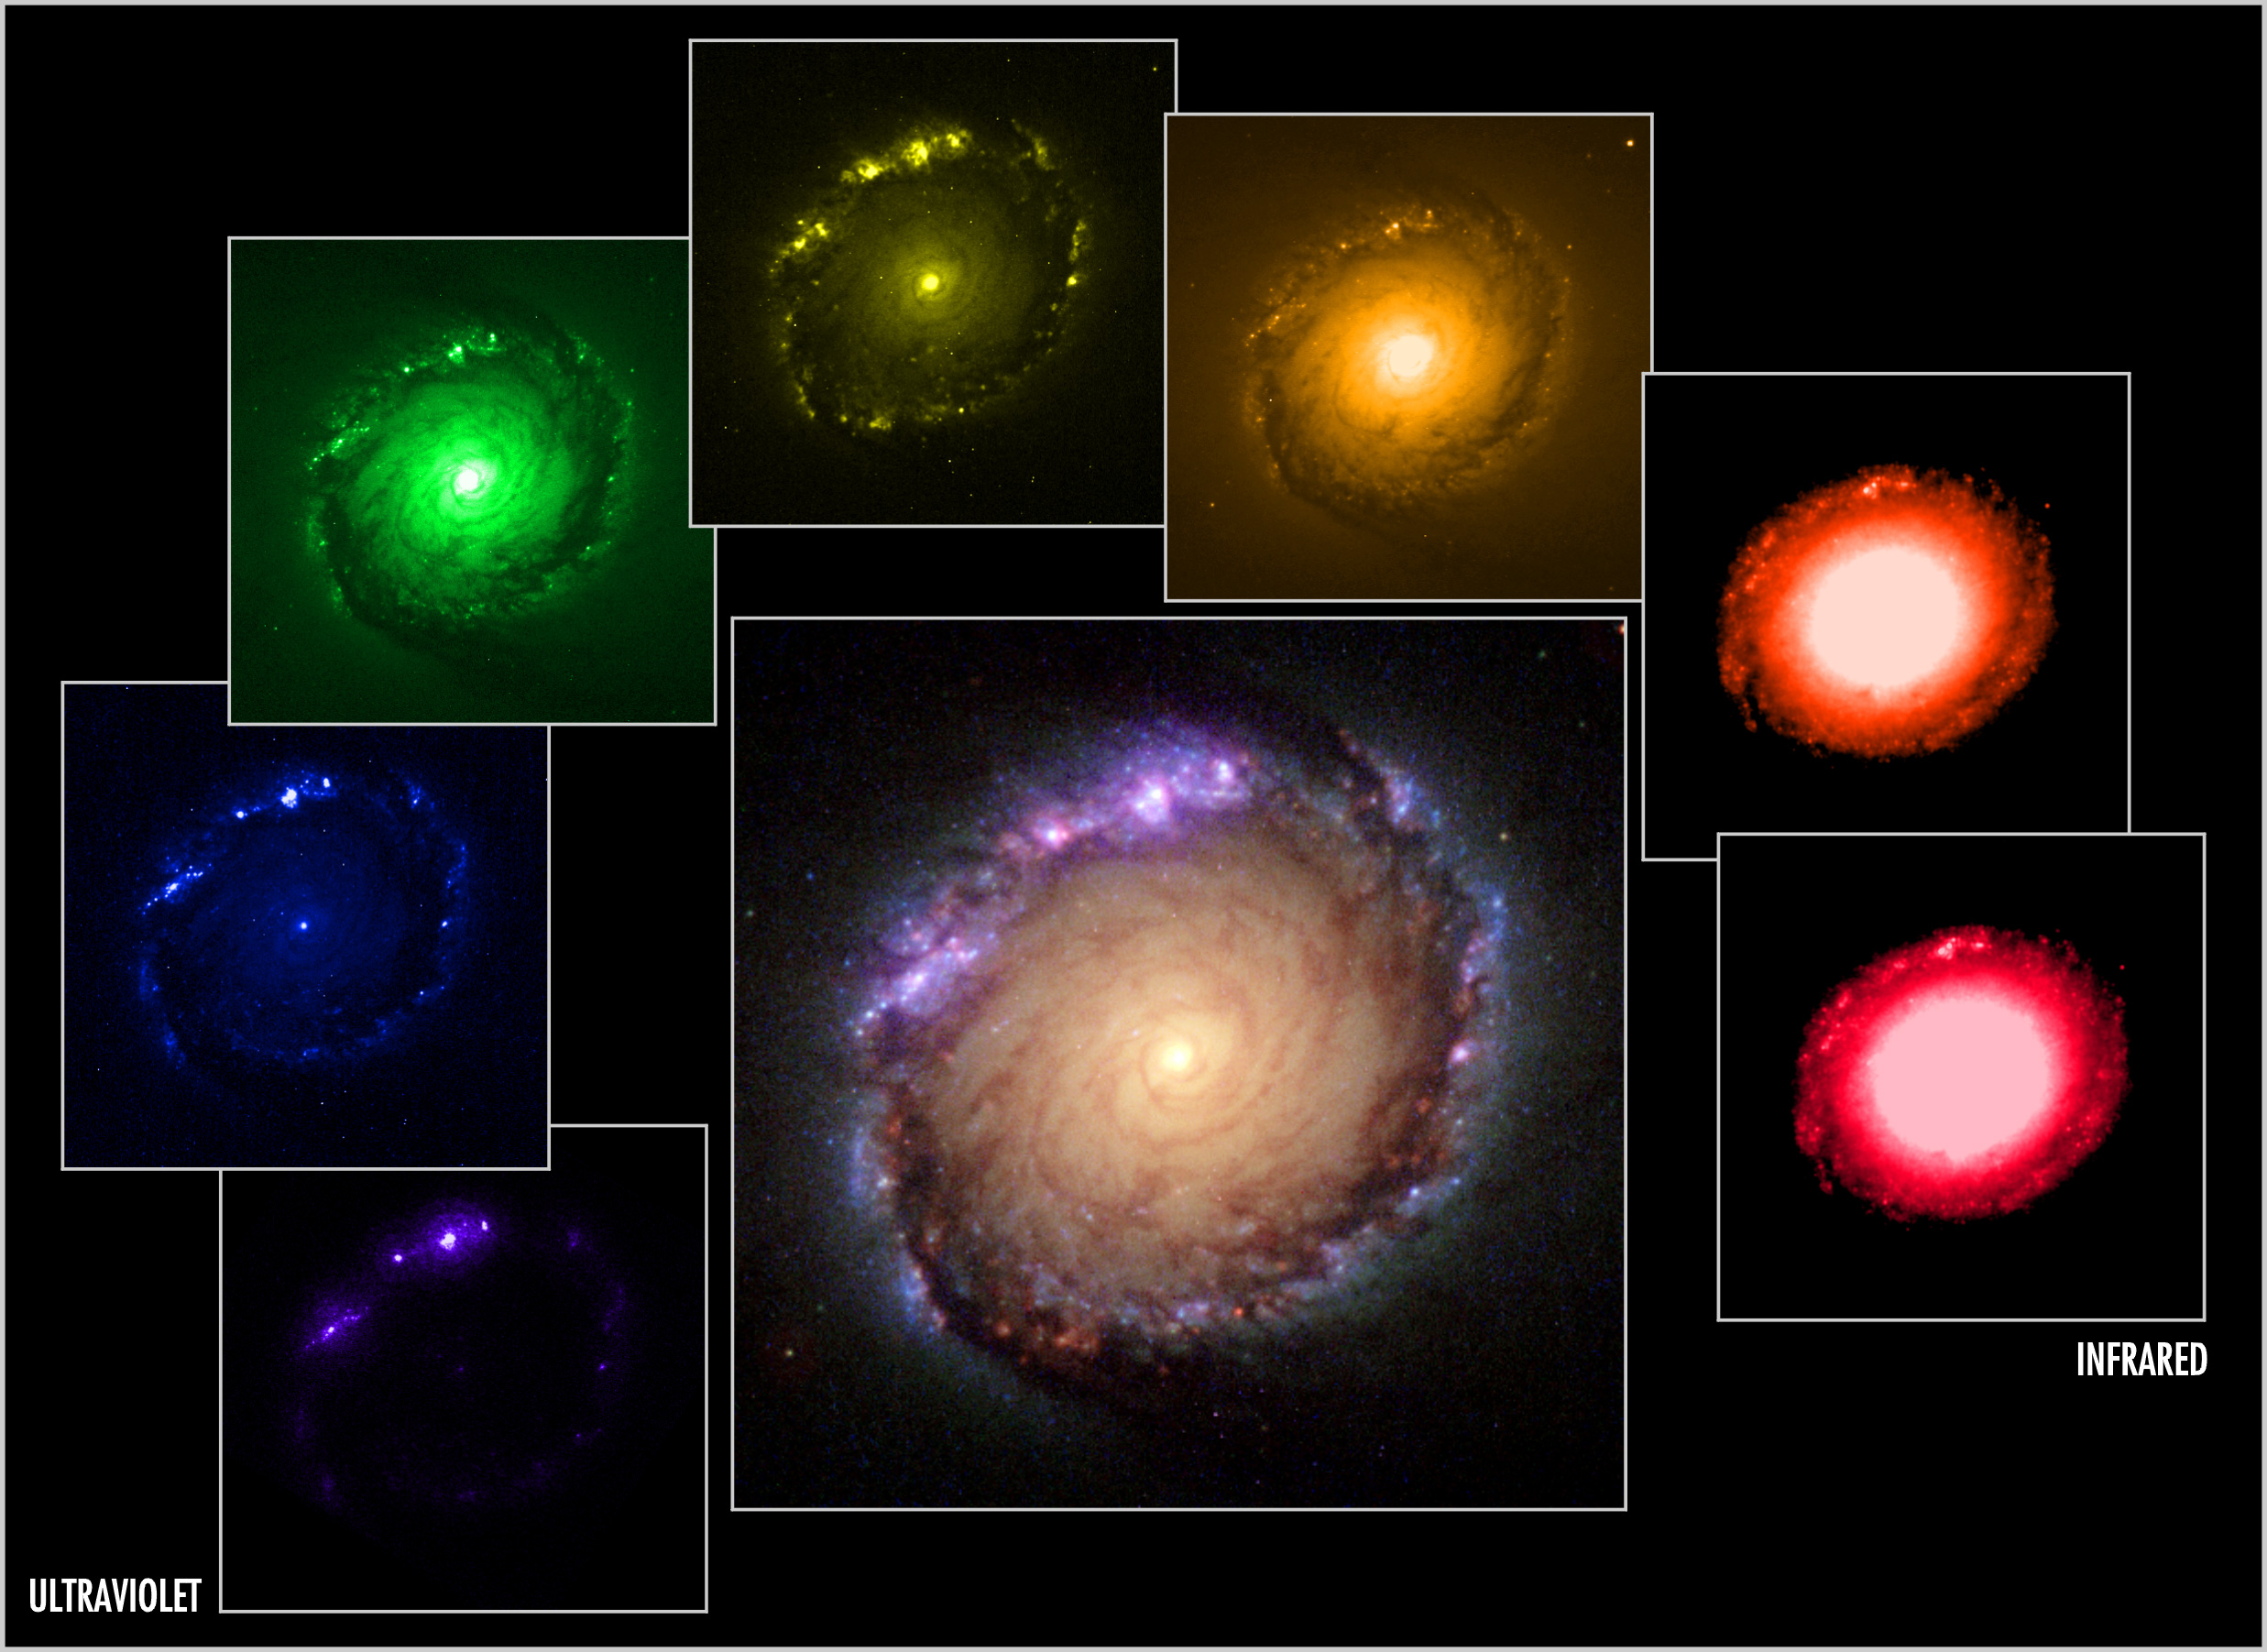
Image of
NGC 1512 courtesy of
NASA ,
ESA ,
and Dan Maoz.
But if one moves farther away from the optical, one discovers that the appearance of galaxies can change drastically.
Here's an elliptical galaxy observed in the X-ray, optical, and radio.
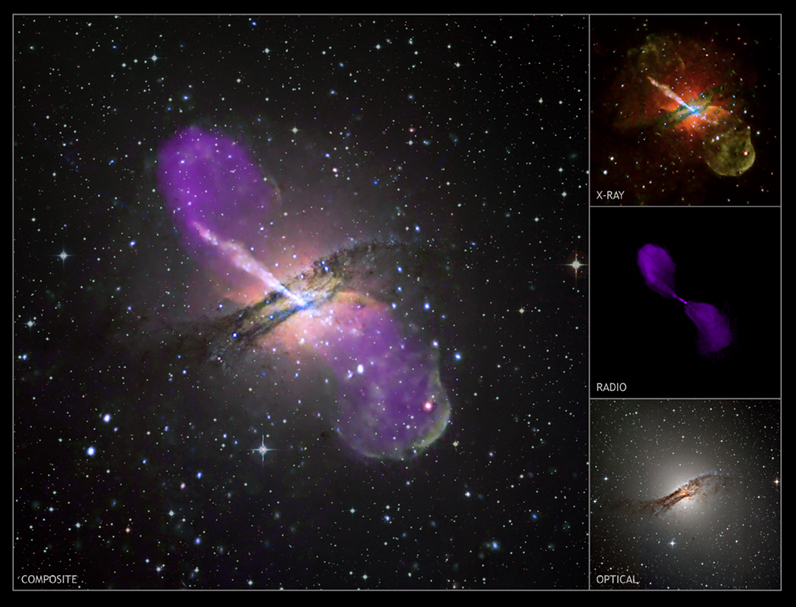
Images of
Centaurus A
courtesy of
NASA ,
and
R. Kraft et al.,
NSF/VLA and Martin Hardcastle,
ESO/WFI and M. Rejkuba et al.
  Q:  What is the source of the optical light?

      What is the source of the radio emission?

      What is the source of the X-ray emission?
Here's another multiwavelength view, this time of the interactive pair of spiral galaxies known as the Antennae . The image below is a composite of optical (gold and brown), X-ray (blue) and mid-infrared (red).
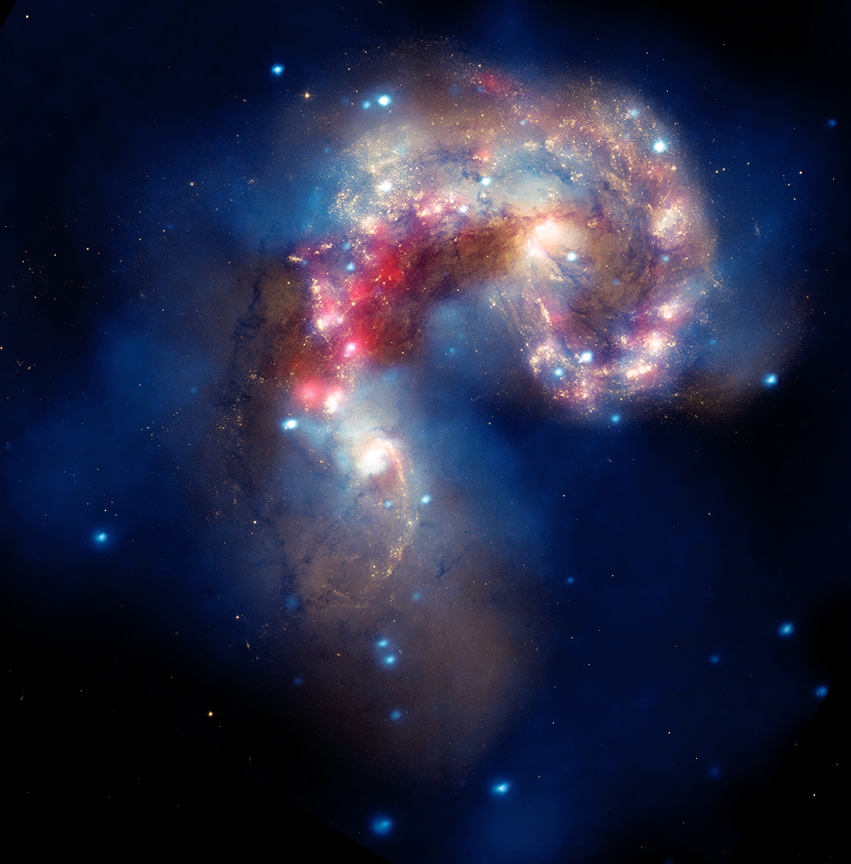
Image of Antennae courtesy of
NASA and STScI,
Chandra Center and DePasquale,
Spitzer and JPL/CalTech.
  Q:  What is the source of the optical light?

      What is the source of the infrared emission?

      What is the source of the X-ray emission?
It turns out that galaxies tend to have radial profiles which follow one of two patterns. It's hard to tell the difference if one plots surface brightness in linear units -- though it is clear that one type is more centrally condensed than the other.
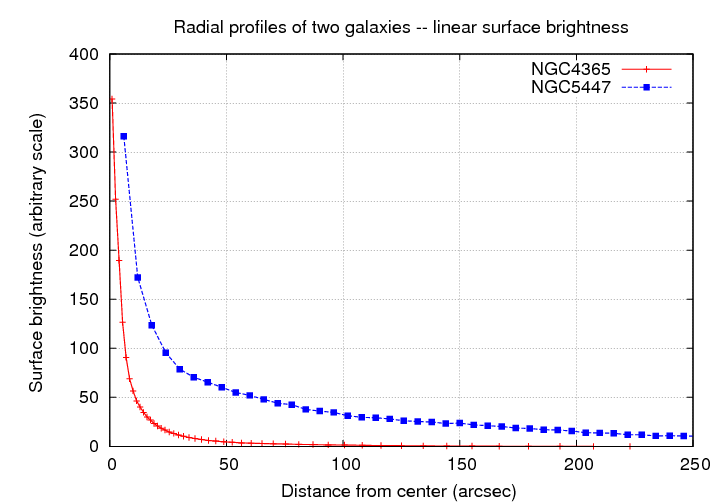
If we use logarithmic units to display the surface brightness, each type of galaxy shows a nice straight line (well, if we ignore the very center), but the slopes are quite different.
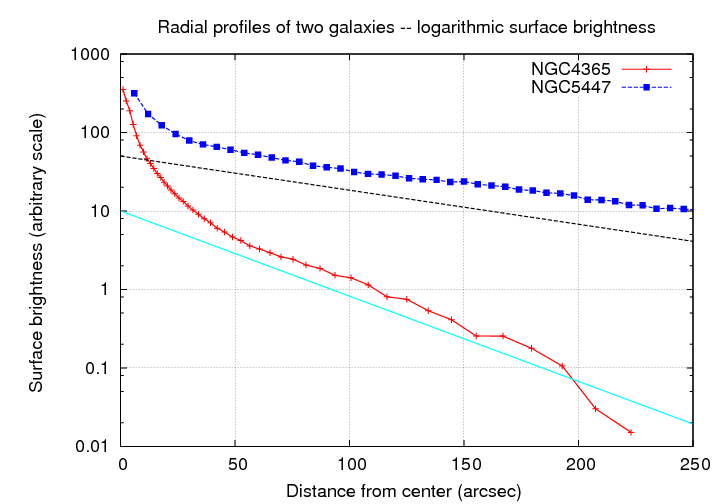
  Q:  What sort of mathematical model
      produces this sort of pattern?

  Q:  What's happening near the center?
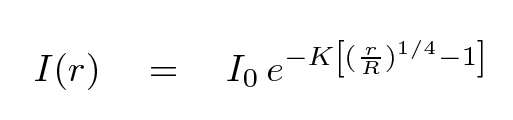
It turns out that, as a very general rule, spiral galaxies tend to have profiles in which the intensity of light decreases exponentially from the center, which can be expressed in terms of linear intensity
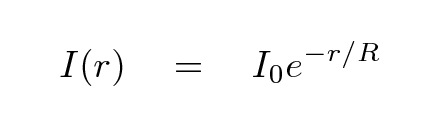
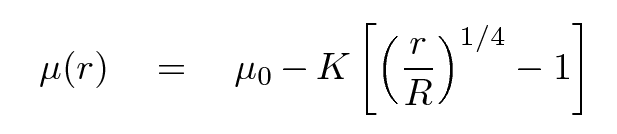
or in terms of magnitudes per square arcsecond
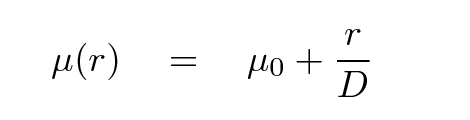
One the interesting things about spiral galaxies is that the value of their central surface brightness, μ0 in the equations above, has a remarkably similar value for the majority of galaxies, of order μ0 = 20.0 magnitudes per square arcsecond in the SDSS r-band.
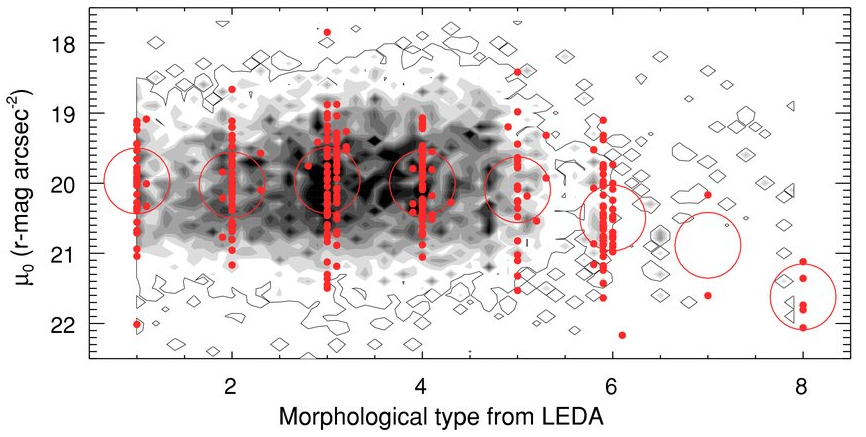
Figure taken from
Kambiz, ApJ, 722L, 120 (2010)
Elliptical galaxies also exhibit an exponential relationship between surface brightness and radius, but the characteristic scale lengths tend to be smaller. For historical reason, however, astronomers often choose to put the relationship into a mathematical form which looks like this, often called the "deVaucouleurs Law".
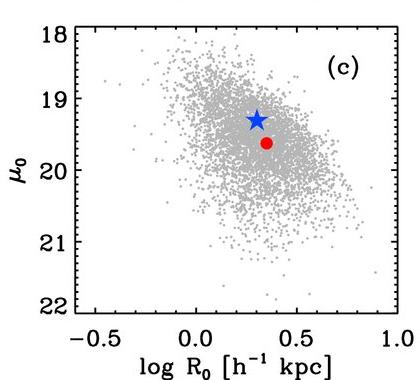
Elliptical galaxies tend NOT to have similar values for their central surface brightness. Instead, the larger and more luminous galaxies have relatively small central surface brightness, while the smaller systems tend to have higher surface brightness.
These two different mathematical forms -- the ordinary exponential and the deVaucouleurs version -- can be turned into each other with a little manipulation of the constants.
We know that there are many more feeble galaxies than powerful ones. But is the relative number of feeble-versus-powerful the same for all galaxies, or does some group tend to have more 97-pound weaklings?
The answer is -- no, not all galaxies share the same ratio of weak to monstrous. In clusters, at least, elliptical galaxies provide most of the high-luminosity members, while spirals dominate at the feeble end. The two figures below show the same general behavior, whether one separates galaxies into late-type and early-type using concentration index ....
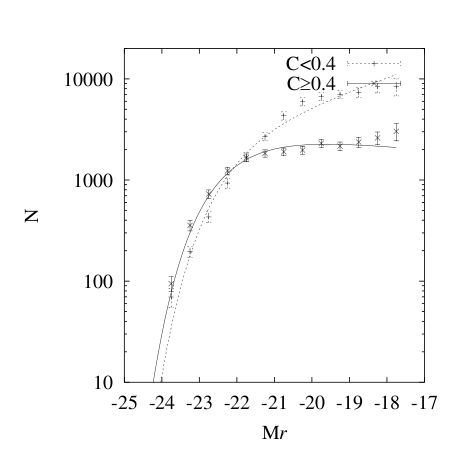
Figure taken from
Goto et al. PASJ, 54, 515 (2002)
... or color.
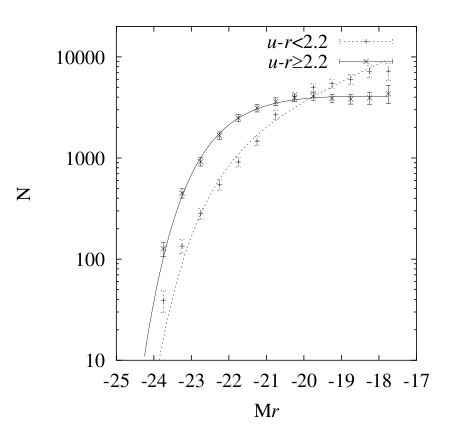
Figure taken from
Goto et al. PASJ, 54, 515 (2002)
What sort of galaxies are the most common? It turns out that the answer to that question depends on where you are looking. If you look in the "field" -- that is, at some random area of the sky where galaxies are scattered at random -- you will find a preponderance of late-type galaxies. But if you focus your attention near a rich cluster, you will find more early-type galaxies.
One way to quantify this is to compute the local density of galaxies in many different places, and then examine the fraction of early-type and late-type galaxies as a function of the local density. The results are pretty clear:
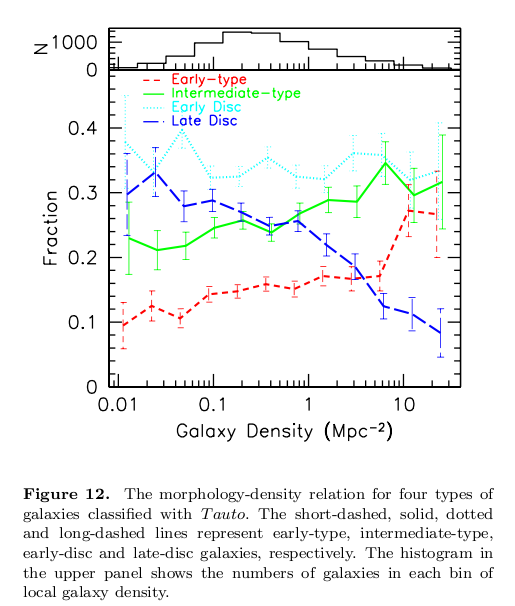
Figure taken from
Goto et al. MNRAS 346, 601 (2003)
There's a twist to this familiar tale that clusters of galaxies are dominated by ellipticals. If one examines clusters at low and high redshifts, one will find that the high-redshift clusters have more spirals -- or late-type galaxies, anyway -- than the low-redshift clusters. This is known as the Butcher-Oemler effect.
In the figure below, there are four panels. Each one measures the fraction of late-type (spiralish, blueish, diffuseish) galaxies in clusters as a function of redshift. The four panels correspond to four methods of identifying late-type galaxies:
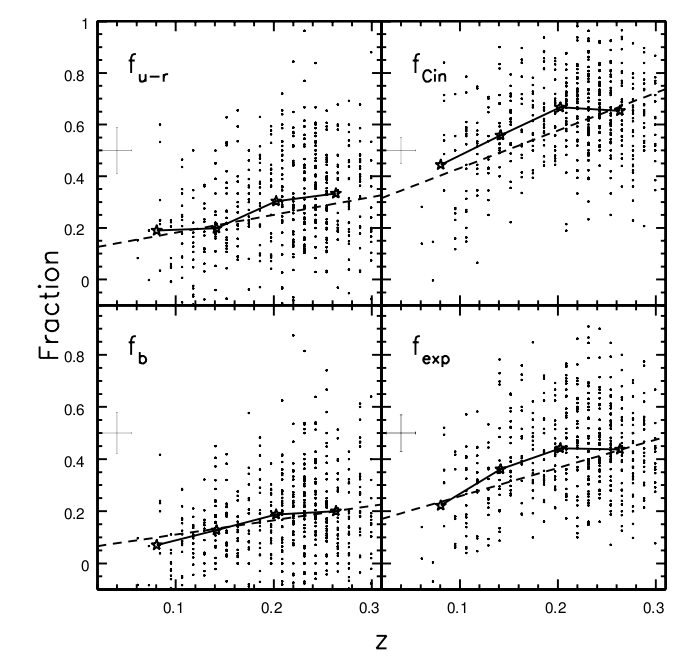
Figure taken from
Goto et al. PASJ 55, 739 (2003)
Copyright © Michael Richmond.
This work is licensed under a Creative Commons License.