 Copyright © Michael Richmond.
This work is licensed under a Creative Commons License.
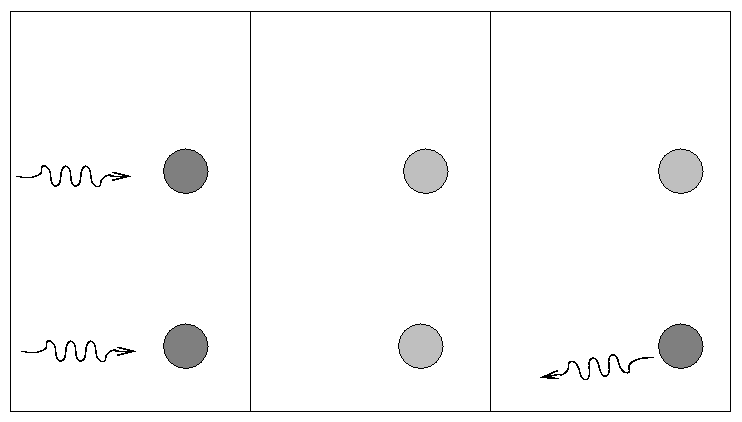
You are familiar with situations in which an atom absorbs a photon and becomes excited as a result:

Alas, there are no simple formulae to calculate the opacity due to absorption by atoms and ions (and molecules, if any exist). One must slog through all the possibilities: make a list of all species in some region, then look at all the transitions within each species. There can be a LOT of transitions to consider. Here, for example, are the lines one might consider in the tiny, tiny little region:
Each line has its own "oscillator strength", which indicates the probability that a passing photon of the appropriate wavelength will actually be absorbed. You can imagine how hard it can be to calculate the overall opacity of a stellar atmosphere which contains several tens of common types of atoms and ions, each of which has hundreds or thousands of lines over any range of interest....
You've also heard of "bound-free" transitions, though perhaps the more common name for them is ionizing absorptions. If a photon has enough energy, its absorption can knock an electron free from an atom and send it off with the leftover energy in kinetic form.
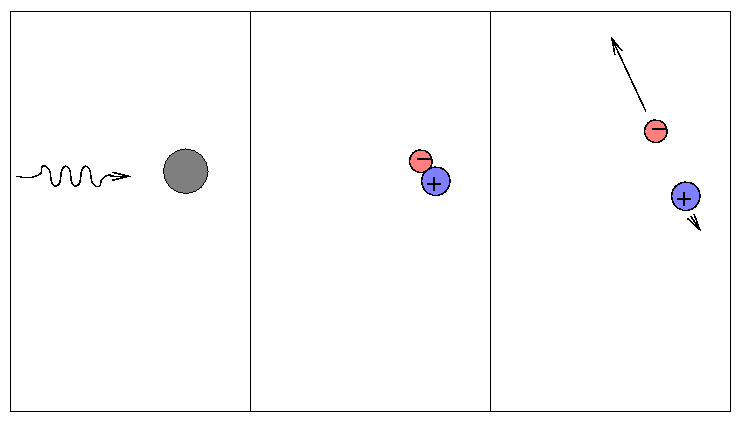
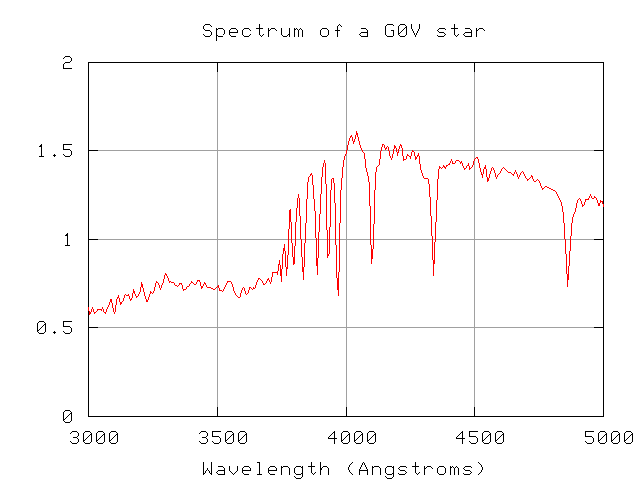
Bound-free transitions are responsible for the presence of "edges" in the spectra of stars (and in laboratory experiments, too). An "edge" is a sudden change in the spectrum of a material. In the G0V star below, for example, the intensity of light in the continuum rises sharply as one moves from 3500 Angstroms to 4000 Angstroms.
Exercise:
- Estimate the wavelength of this "edge".
- Can you explain the atomic transition which is responsible for this feature? Hint: it involves hydrogen.
We call this edge the Balmer jump.
The basic idea is that
Therefore, the opacity of a material will increase at wavelengths shorter than one of these critical edges.
The Balmer jump is a strong feature in stellar spectra, but there is one even stronger edge: the Lyman limit, which occurs at the wavelength which will just ionize a hydrogen atom from its ground state.
Exercise:
- Calculate the wavelength of the Lyman limit.
- In what portion of the electromagnetic spectrum does it lie?
- Can we observe this portion of the spectrum with ground-based observatories?
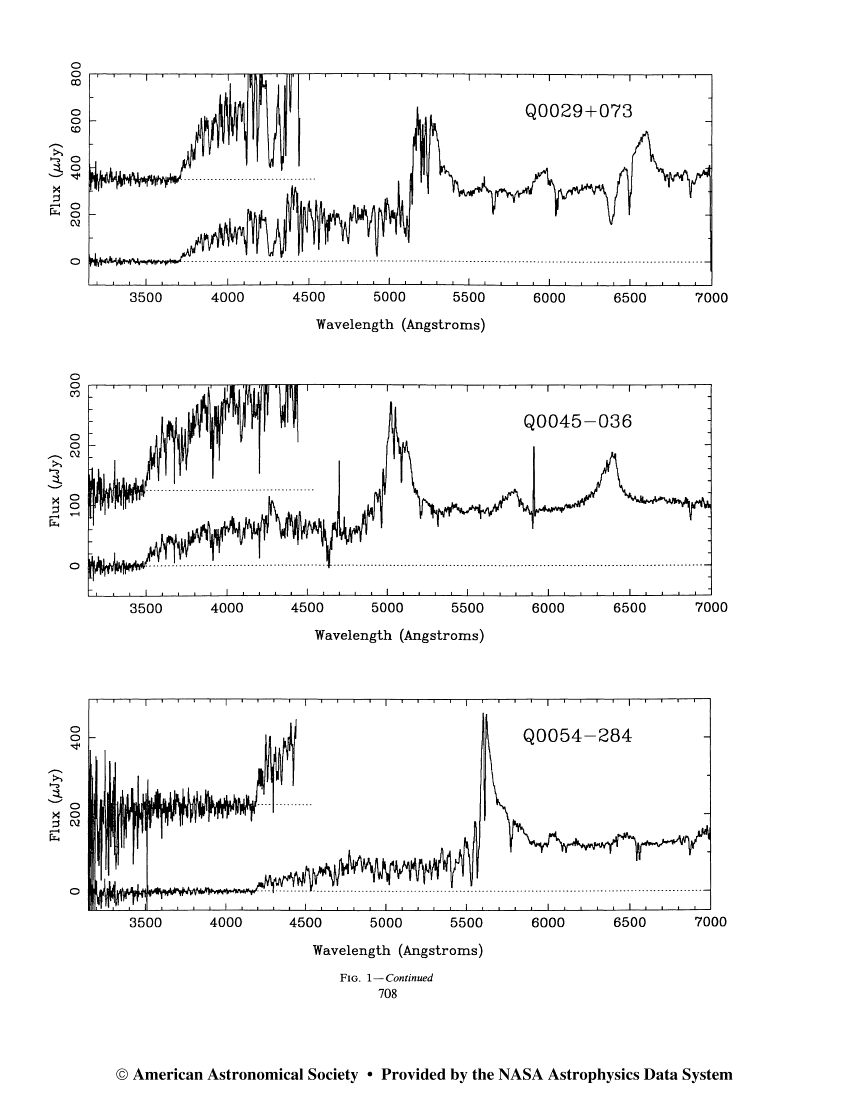
Although we can't see this region of the spectrum from the ground for nearby stars, we CAN detect it for some very distant objects. Galaxies at great distances from the Milky Way follow the expansion of the universe, and hence are moving away from us at high speeds. At some point, the Lyman limit becomes redshifted into the visible portion of the spectrum. When it does, we can observe directly the difference between the intensity of light on both sides of the sharp edge:
Exercise: The redshift of an object, z, is defined as(shift in wavelength) z = --------------------- (rest wavelength)
- What is the redshift of galaxy Q0054-284 in the figure above?
- Can you explain the emission line at about 5600 Angstroms?
This sharp drop in intensity can cause a galaxy to "wink out" and disappear if measured through a filter which is on the blue side of the Lyman limit.
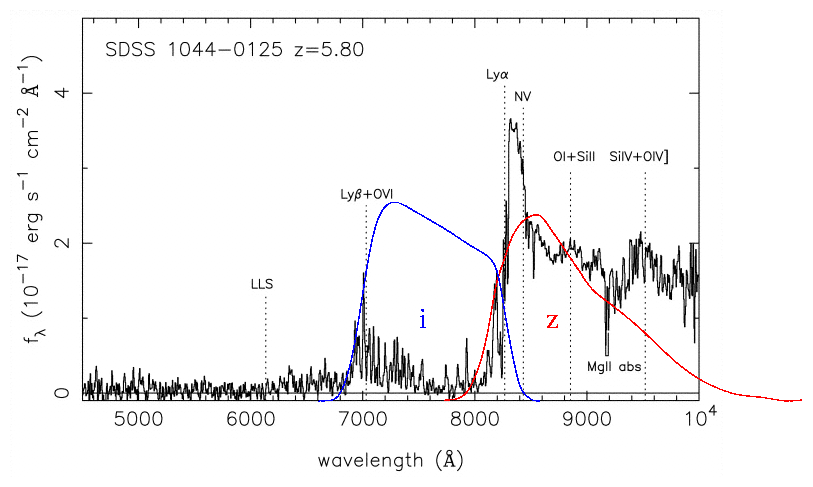
Some astronomers now use the "Lyman dropout" technique to search for high-redshift galaxies: take pictures through several different filters, and look for objects which are much fainter in the bluest one.

When a free electron happens to be passing by a nucleus, it may absorb an electron (as opposed to scattering it). We call this a "free-free" or bremsstrahlung process.
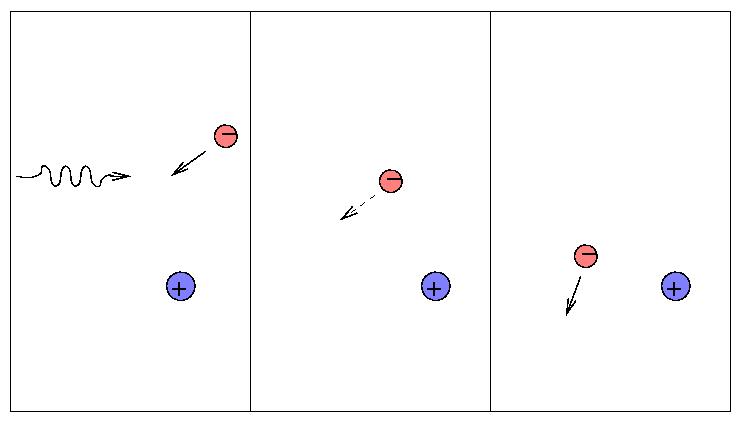
Since it requires lots of free electrons, it is most important at high temperatures. You will encounter bremsstrahlung transitions frequently if you study X-ray properties of gas at millions of degrees in accretion disks ... but you won't see it much in discussions of the atmospheres of sun-like stars.
A single, isolated electron cannot absorb a passing photon (why not?), but it can scatter it into some other direction.
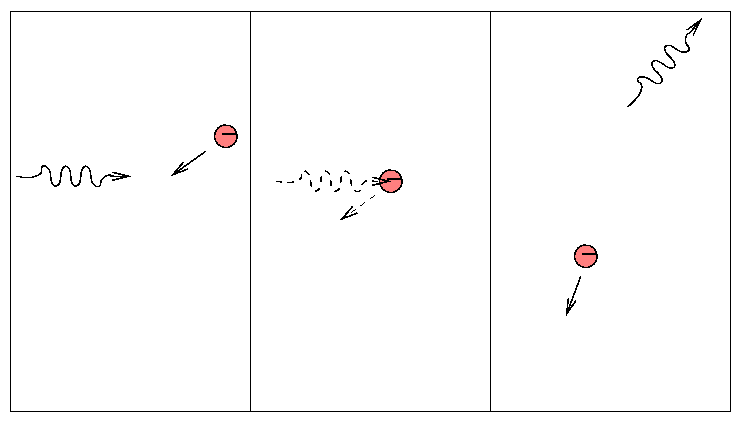
This is a simple process, depending only on the "Thomson cross section" of the electron.

People sometimes use this scattering cross section to define the "radius" of an electron.
Because the Thomson cross-section is so small, electron scattering is usually not an important contributor to the total opacity. It dominates only at very high temperatures, where the other sources tend to decrease.
Okay, so there are several different mechanisms by which photons are scattered or absorbed. Is there some way we can bundle them all together into a single formula? It surely would be nice to specify some temperature, density and chemical composition, and get in return the corresponding opacity κ.
We could ask for either the total opacity as a function of wavelength:

or we could take some sort of average over all wavelengths to define a mean opacity, sometimes called the Rosseland mean opacity:

Let's look at each of the terms in this mean opacity:
We can compare all but the bound-bound term in a qualitative way: there are approximate formulae in your textbook (see page 274). This oversimplified graph shows the relative contributions at a constant density of 0.0001 sq.cm per gram.
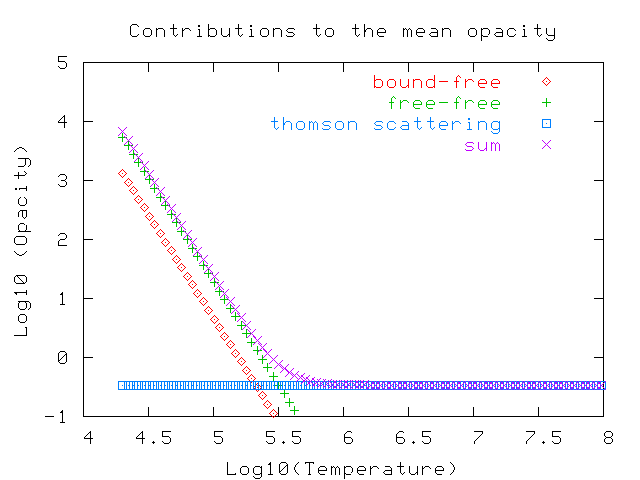
Note how the electron scattering term dominates at temperatures above a million degrees or so, where there aren't many ions with bound electrons any more.
You can find a much more sophisticated graph in your textbook on page 275.
 Copyright © Michael Richmond.
This work is licensed under a Creative Commons License.