 Copyright © Michael Richmond.
This work is licensed under a Creative Commons License.
Copyright © Michael Richmond.
This work is licensed under a Creative Commons License.
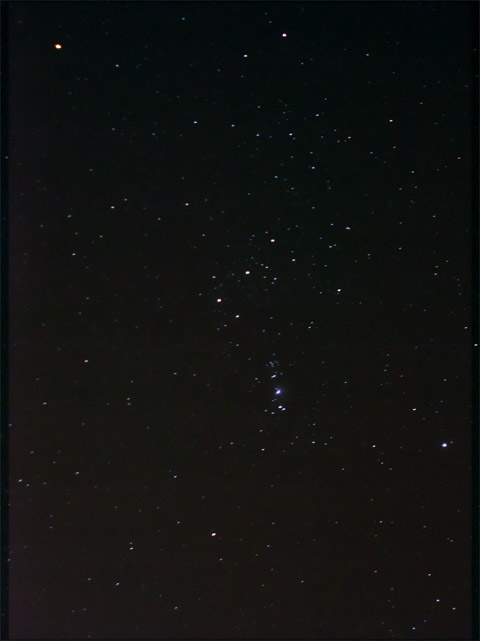
What color is the star Betelgeuse? It's the bright star at upper left in this picture of Orion taken by a student at the RIT Observatory.
Orange? Red? Yellow? These are all reasonable answers in everyday conversation, but not when talking to an astronomer. To an astronomer, the color of Betelgeuse is ...
Yes, to optical astronomers, "color" means something different than it does to most ordinary people. "Color" is defined as
the difference between the magnitude of a star in one passband and the magnitude of the same star in a different passband
In the most common example, the passbands are the Johnson-Cousins B and V. Consider several stars in the constellation of Crux, the Southern Cross:
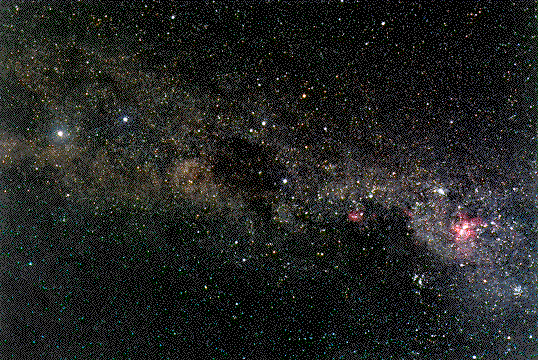
Credit & Copyright:
Greg Bock,
Southern Astronomical Society
Clockwise from the bottom of the cross, they are
   Star          m(B)    m(V)     (B-V)
----------------------------------------
 alpha Crucis    0.56    0.81     -0.25
 beta  Crucis    1.15    1.30     -0.15
 gamma Crucis    3.22    1.63     +1.59
 delta Crucis    2.59    2.78     -0.19
----------------------------------------
How can we interpret the color index? One way is to go back to the star Vega, the basis for the magnitude scale. Vega has m(V) = 0, m(B) = 0, so obviously its color index is (B-V) = 0.0. Therefore,
By this criterion, the constellation Crux is unusual in its wealth of very blue stars. Most stars you can see with your naked eye are considerably redder than Vega, and thus have positive (B-V) values.
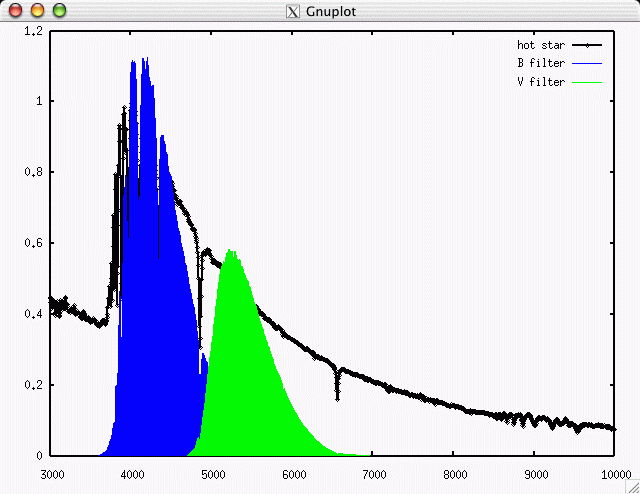
Another way to look at the color index is to go back to the convolution of spectrum with passband. Convolving the spectrum of a hot star with the B and V passbands ...
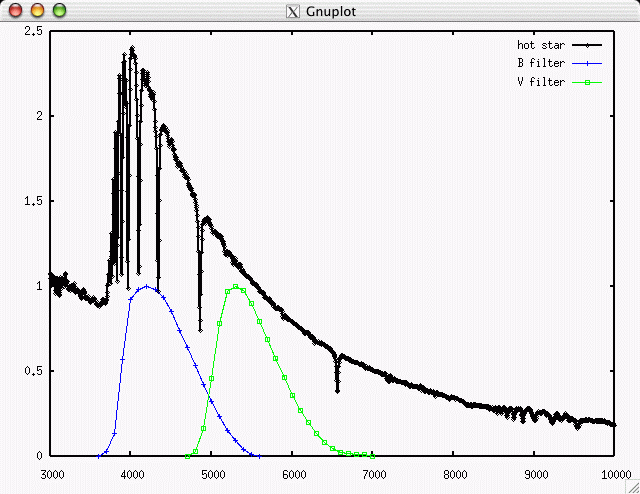
yields a lot more energy (and photons) in the B-band than the V-band.
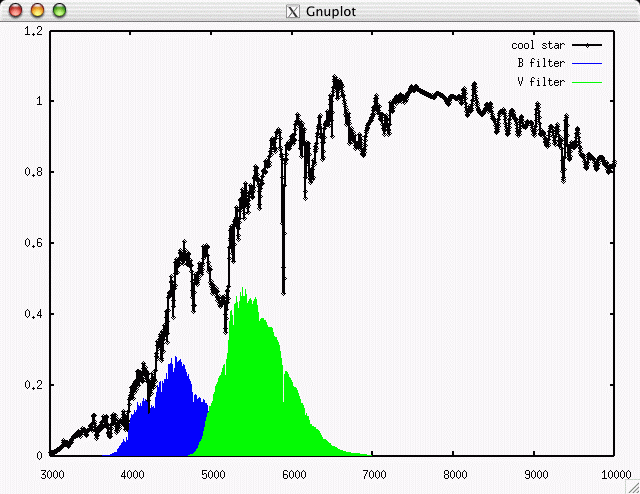
On the other hand, convolving the spectrum of a cool star with the B and V passbands ...
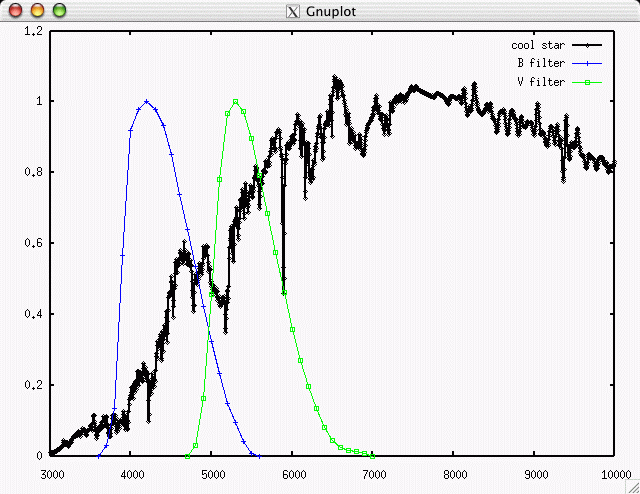
yields much less energy (and photons) in the B-band than the V-band.
Magnitudes are logarithmic, so a difference in magnitudes (B-V) corresponds to a ratio of fluxes F(V)/F(B) (and note the inverse nature of the ratio).
Remember, (B-V) = 0.0 for the hot star Vega. The Sun has (B-V) = 0.65 or so (Gray, PASP 107, 120, 1995), though it's actually very hard to measure accurately.
The most common color index used in astronomy is (B-V), in part due to history (photographic plates are most sensitive to blue light), in part due to physics (this particular combination is a pretty good guide to temperature). But one can also define the color index of any pair of passbands. Some of the most common are:
The color index seems like a silly thing to use. Why define this strange property, based on the magnitude scale with its arbitrary zero point, when the spectrum of the object provides so much more information? Why not describe stars on the basis of their spectrum? For example, there are empirical divisions of stars, based on their spectra, into classes such as A0 and B5 and G2. Why bother with the color index when one could use the spectral type?
Q: What's the advantage of the color index?
The answer is pretty simple: time. It takes a lot of time and effort to acquire the spectrum of a star. In order to measure the spectrum of a star, one must disperse its light via a prism or grating. Spreading the light out over a detector shows how much appears at each wavelength ... but it also provides much less light at each spot on the detector. That means that exposure times for spectra are much, much longer than exposure times of equivalent signal-to-noise for images.
In the Sloan Digital Sky Survey, for example, the same 2.5-m telescope is used to take pictures of stars and galaxies one night, and then acquire spectra on a later night. The broadband filters of the SDSS allow one to detect stars and galaxies down to roughly magnitude V=21 in an exposure time of about 55 seconds. But a relatively low-dispersion spectrum like this:
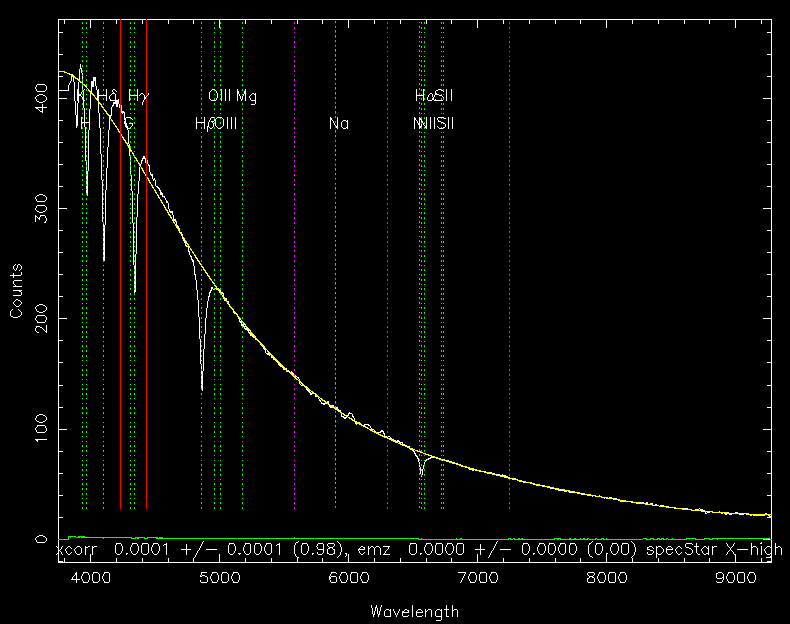
requires an exposure time of roughly one hour. In fact, the SDSS limits their spectra of stars and galaxies to objects brighter than about V=19. So even though object A is at least six times brighter than object B, the SDSS spends about 60 times longer taking a spectrum of A than it does an image of B.
Moreover, one can obviously measure the magnitudes, and hence colors, of tens of thousands of stars in a single wide-field exposure, but spectra aren't so easy. Placing a prism in front of the telescope objective (the "objective prism" technique) can place hundreds of little spectra onto the focal plane at once (these examples come from the KISS project at Kitt Peak)

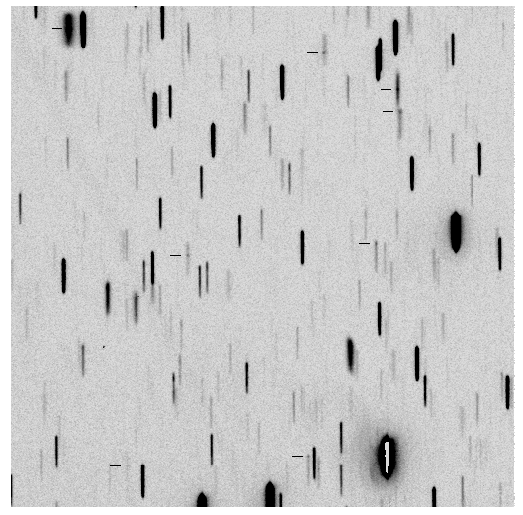
but there's just no way to fit as many little strips of spectra onto a given area as one can fit tiny points of light.
The bottom line is that one can much more easily and quickly measure color indices than spectra. Astronomers, being practical people, therefore adopted the color index as one of the basic parameters used to describe a star.
Obviously, the color index is related in some way to the temperature of the star. Hot stars will have negative values of (B-V), and cool stars positive values. But can one say anything more definite?
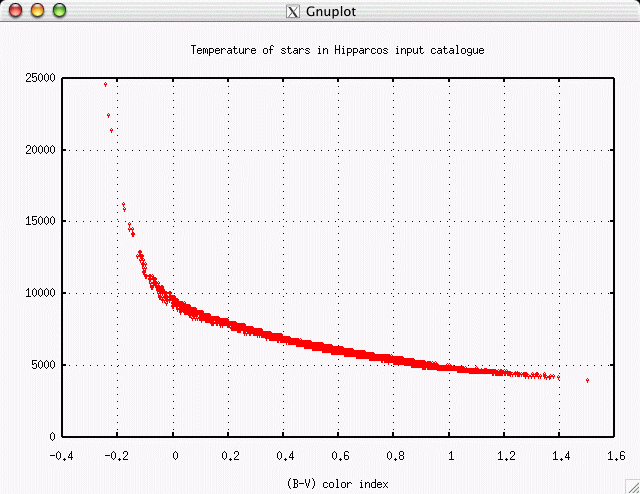
It looks as if it might be possible to define a two-part linear relationship which converts (B-V) color index to temperature, at least for the majority of normal stars.
  Q:  What is the equation of a linear fit
      to the "cool" section of this diagram?

  Q:  What is the equation of a linear fit
      to the "hot" section of this diagram?
One can make a color-color plot by arranging stars in a two-dimensional graph, where each axis measures a different color index. Below are some examples from the SDSS, which uses a set of broadband filters called (u, g, r, i, z); they are very roughly equivalent to (U, B, R, I, _). Ordinary stars fall onto a locus in color-color space which runs from lower-left to upper-right in a (g-r) vs. (u-g) diagram:
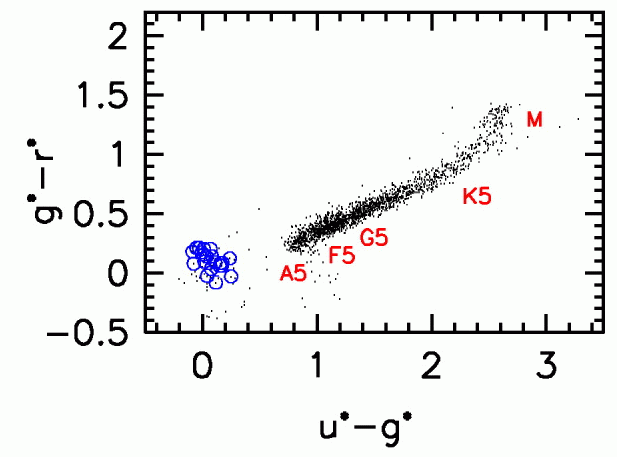
Q: At which end of the locus are the hot stars?
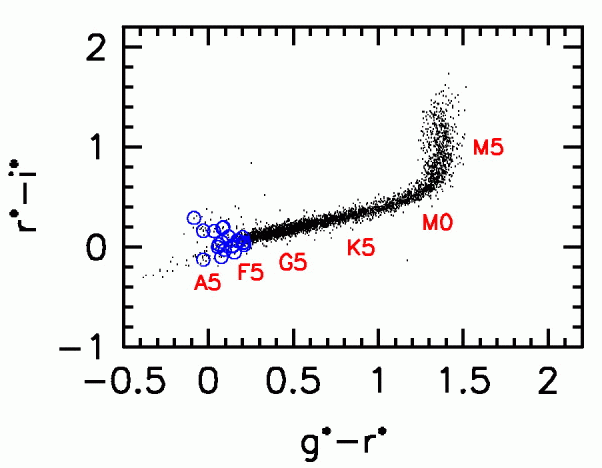
If we use a different pair of colors, (r-i) vs (g-r), the position and shape of the stellar locus changes slightly.
One can use these color-color graphs to determine the temperature or spectral type of a star. But one can also focus on objects which lie OFF the stellar locus.
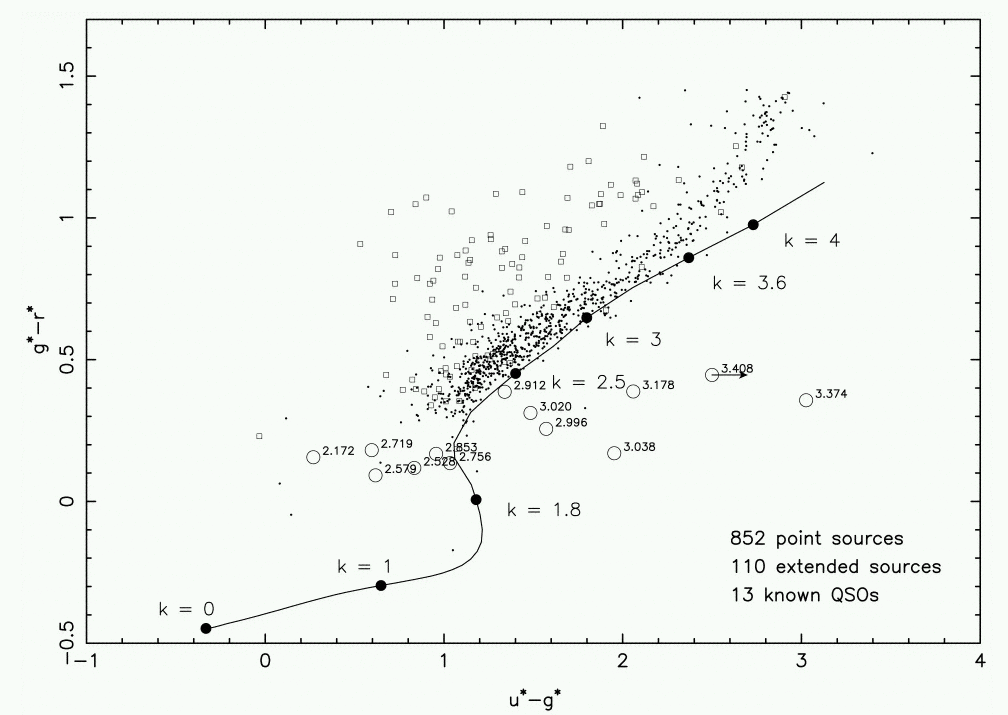
In the graph above, ordinary stars are shown by dots, galaxies by squares, and quasars by large open circles. There's a clear distinction between stars and galaxies, and (some) quasars are easy to pick out because they lie far away from everything else.
One can go even further, using color-color properties to classify galaxies into different types. Here's a graph showing the location of hundreds of galaxies observed by the SDSS in the (g-r) vs. (u-g) diagram.
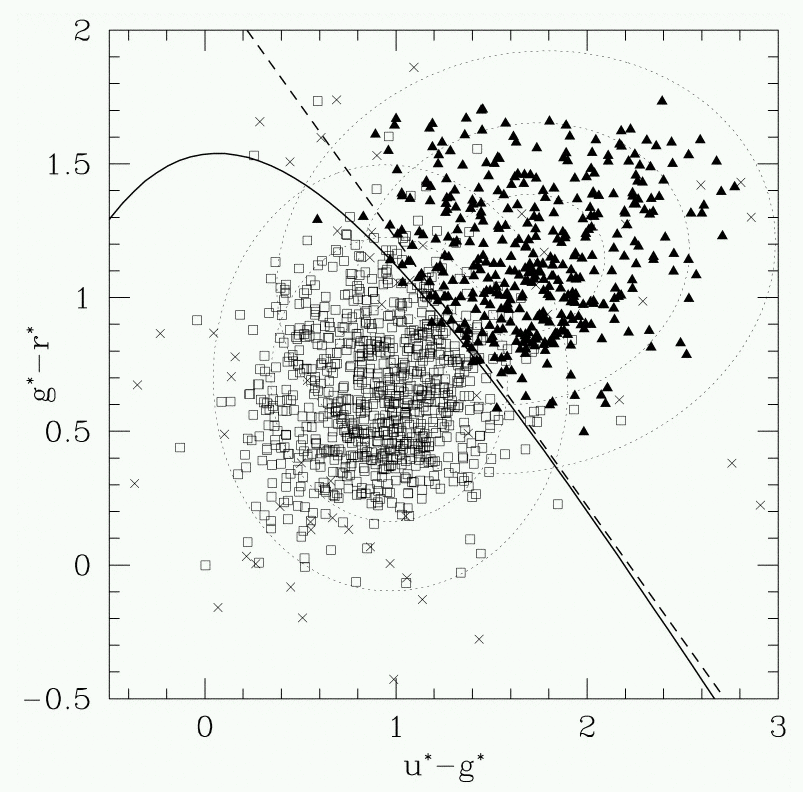
An automatic classifying algorithm has decided that there are two groups of galaxies based upon their colors alone. Perhaps these two groups correspond to spiral and elliptical galaxies:
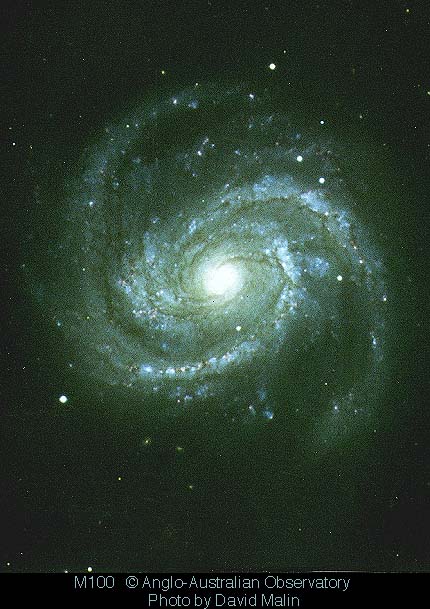
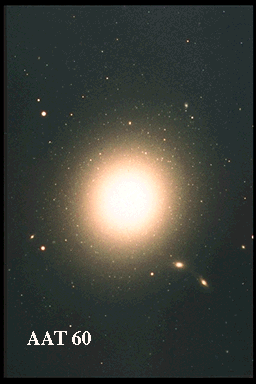
Q: Which group is spirals, and which is ellipticals?
In the early years of the twentieth century, astronomers began for the first time to collect very large numbers of quantitative measurements of stars and distribute them widely in a series of catalogs. It became possible for scientists to look for trends and correlations in the properties of stars, since they now had large enough samples to be statistically significant. Two astronomers, American Henry Norris Russell and Dane Ejnar Hertzsprung, found that, if one made a graph with color index on the horizontal axis, and absolute magnitude on the vertical axis, then the great majority of stars fell along a roughly diagonal line running from top left to bottom right:
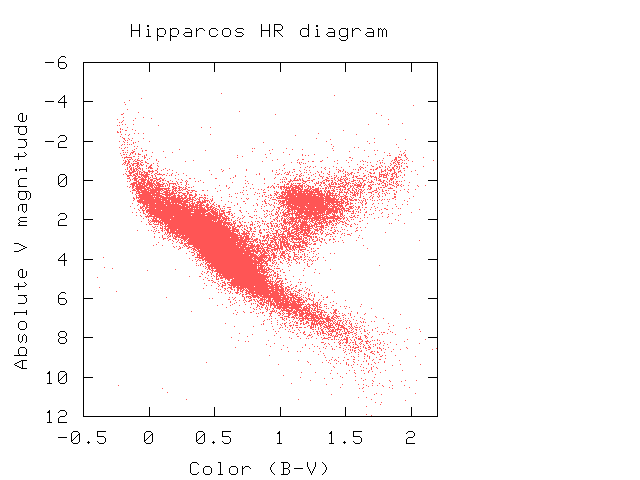
This particular sort of graph is now known as an HR diagram in honor of Hertzsprung and Russell. The fact that most stars lie along a relatively straight line (called "The Main Sequence") is actually an indication that .... what?
Copyright © Michael Richmond.
This work is licensed under a Creative Commons License.