
 Copyright © Michael Richmond.
This work is licensed under a Creative Commons License.
That model doesn't make any sense. The absolute change in resistance of an object cannot depend solely on the temperature: it depends on the size and shape of the object, too.
But it might make sense for the relative or fractional change in resistance of an object to depend solely on its temperature. In other words, the resistance might increase by 1 percent for every increase of 1 degree Celsius; so a teeny wire would still have a teeny resistance (just a teeny bit larger than before, in ohms), and a long cable would still have a big resistance (a lot larger than before, in ohms).
Mathematically speaking, a relative or fractional dependency can be written like this:
                                        [                       ]
      resistance(T)  =  resistance(To)  [  1   +  A * (T - To)  ]
                                        [                       ]
This is slightly different than the earlier formula -- see?
In this case, if we look at the change in resistance (or resistance) as a function of change in temperature, we find
                               resistance(T) - resistance(To)
    resistance(To) * A    =   -------------------------------
	                                   T  -  To
And now, if you were to plot resistance versus temperature, the slope of the graph would be resistance(To) * A. This slope would NOT the be same at all temperatures, because it depends on the resistance at the reference point.
Question 5: What would the units of this coefficient be?
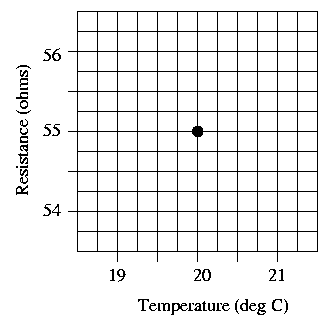
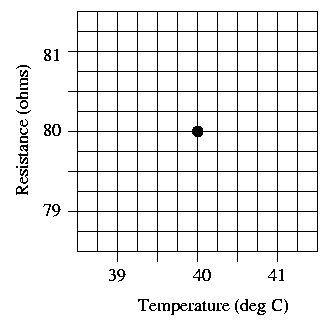
Once again, the graphs below show close-ups of the behavior of resistance as a function of temperature, near reference temperatures of To = 20 and To = 40 Celsius. Use the new coefficient (expressing fractional change in resistance with temperature), assuming a value A of exactly 0.02. Draw marks at the resistance values one degree above and below the reference temperature on each graph, and use them to draw a line on each graph showing resistance as a function of temperature.
Question 6: Are the slopes of the two graphs the same?


Assume real copper behaves according to the above equation, with a coefficient of A = 0.02. Consider again the four very different objects:
Question 7: Calculate the resistance of each of the 4 objects at T = 21 degrees.
Question 8: Does that make any sense?
 Copyright © Michael Richmond.
This work is licensed under a Creative Commons License.