 Copyright © Michael Richmond.
This work is licensed under a Creative Commons License.
The point of this experiment is to show you the relationship between voltage and the electric field. You will make measurements of the voltage at a number of points in a pan of water, and then use those measurements to calculate the electric field between the points.
There is a useful analogy which may help you to understand the connection between voltage and electric field.
       On a topographic map           In your experiment today
----------------------------------------------------------------
   (x, y) position is shown     |      (x, y) position is shown
				|
                                |
   contour lines indicate       |        contour lines indicate
        ALTITUDE                |               VOLTAGE
	                        |
	                        |
 calculate the SLOPE of ground  |  calculate the ELECTRIC FIELD
         like so:               |             like so:
                                |
           change in altitude   |             change in voltage
  slope =  -----------------    |  E field =  -----------------
           change in position   |             change in position
                                |
                                |
               (meters)         |               (volts)
        =  -----------------    |          =  -----------------
	       (meters)         |               (meters)
                                |
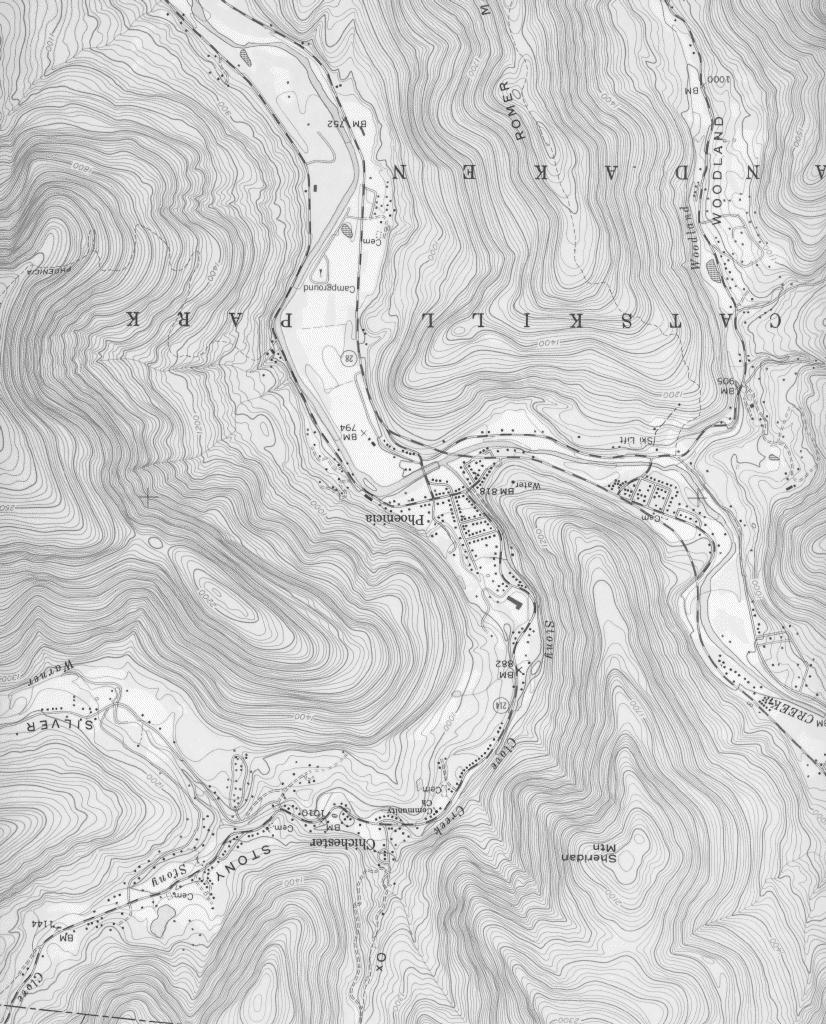
On a topographic map, slope is the derivative of altitude, with respect to position. On the map of your experiment, the electric field is the derivative of voltage with respect to position.
Here's an example of a topographic map: a section of the 7.5-minute series around Phoenicia, New York. The contour lines are at 20-foot intervals. Click on the map to see the full-size version.
 Copyright © Michael Richmond.
This work is licensed under a Creative Commons License.