 Copyright © Michael Richmond.
This work is licensed under a Creative Commons License.
In last week's experiment, you added weights to a little pan, and measured how far the spring stretched. The pan itself had some mass (about 4 grams). The actual relationship between force and mass is
             total force         =  k * x

         m(pan)*g + m(added)*g   =  k * x
If you didn't account for the mass of the pan, and
you measured the distance the spring stretched
from its true rest length (without the spring attached),
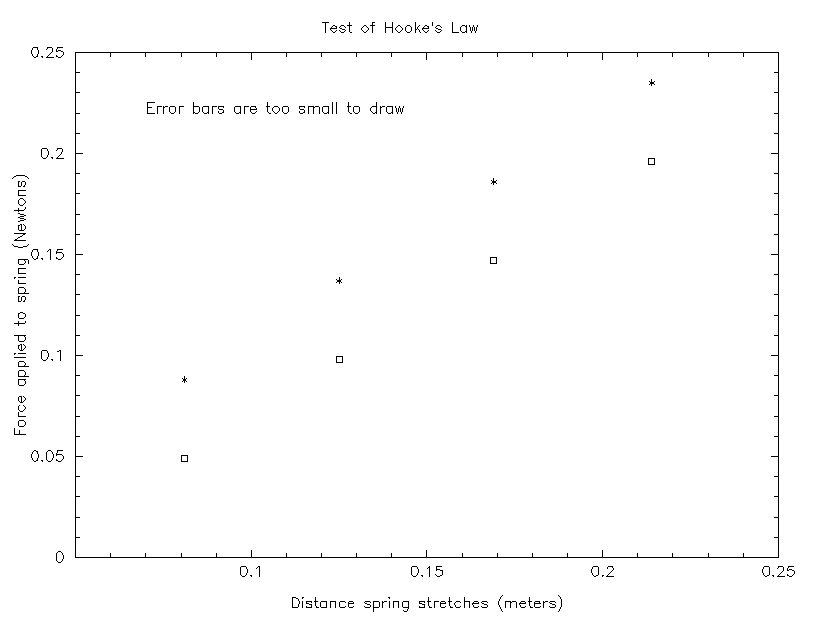
then you would have gotten data just like this:
            This table doesn't include force due to pan

      mass added   Force      distance stretched         derived k
        (kg)        (N)            (m)                     (N/m)
    -----------------------------------------------------------------
        0.005      0.049          0.081                    0.61
	0.010      0.098          0.125                    0.78
	0.015      0.147          0.169                    0.87
	0.020      0.196          0.214                    0.92
Analyzing this data, one row at a time, is saying that
m(added)*g = k * x
But that's wrong!
The real force should have included the force due to the
weight of the pan:
            This table DOES include force due to pan

      mass added Total force  distance stretched         derived k
        (kg)        (N)            (m)                     (N/m)
    -----------------------------------------------------------------
        0.005      0.088          0.081                    1.1
	0.010      0.137          0.125                    1.1
	0.015      0.186          0.169                    1.1
	0.020      0.235          0.214                    1.1
Now, in this case, each individual row _does_ yield the same value for k.
But in either case, a graph would have yielded the proper spring constant, because the slope of (distance stretched) versus (force) is the same!

 Copyright © Michael Richmond.
This work is licensed under a Creative Commons License.