 Copyright © Michael Richmond.
This work is licensed under a Creative Commons License.
Copyright © Michael Richmond.
This work is licensed under a Creative Commons License.
Astronomers want to know how long they need to expose their images. The answer will always depend on purpose for which the data are being acquired: someone who wants to measure the orbit of an asteroid needs merely a bare detection, like these:
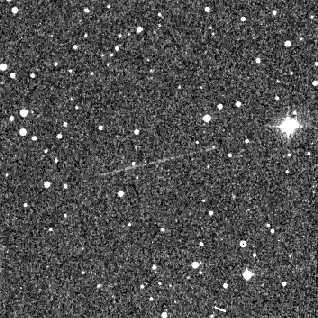
Near-earth object 1999AN10 leaves a faint streak |
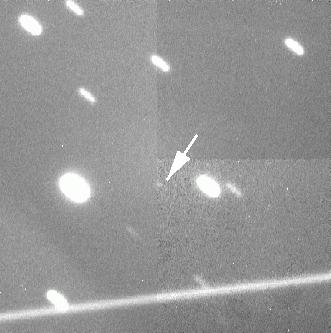
Tracking at just the right rate for asteroid (9969) Braille |
On the other hand, if one is looking for very, very small variations in the light of a star -- due to sound waves moving through its atmosphere, which have extremely small amplitudes:
The light of Wolf-Rayet star WR123 measured by the MOST Satellite
then one needs a much higher signal, and a much longer exposure.
Given a particular scientific question, one can estimate the quality of the data which are needed to answer it. We often describe the quality by the signal-to-noise ratio, sometimes abbreviated SNR or S/N. For our puposes, the S/N is inversely proportional to the fractional error in a measurement:
                                1
       S/N ratio   =  -----------------------
                      fractional uncertainty
So, for example, if the uncertainty in a measurement is 2 percent, the fractional uncertainty is 0.02. The S/N ratio would then be 1/(0.02) = 50.
There is a convenient relationship between S/N and uncertainty in measurements of magnitudes. For relatively small values of uncertainty -- say, less than 20 percent --
uncertainty in mag ~ fractional uncertainty
That is, a measurement with fractional uncertainty 3 percent = 0.03 will lead to an uncertainty of about +/- 0.03 magnitudes.
A more precise version of this relationship states that the uncertainty in magnitudes will be 1.08 times the fractional uncertainty in brightness. You can work this out yourself from the relationship between magnitude and intensity.
That means we can write
                                  1
       S/N ratio   ~   --------------------------
                       uncertainty in magnitudes
As you might expect, to compute the S/N ratio for some astronomical observation, we need to figure out two things:
There is only one source of signal from a star:
the light of the star itself.
If the star causes N(star) photons
to strike the CCD chip during the exposure,
and all of them knock free one electron,
then the image should have N(star) electrons.
That's the signal.
Of course, real detectors don't have 100 percent quantum efficiency. If N(star) photons do strike a detector, maybe only 0.70*N(star) electrons are knocked free.
For the standard astronomical passbands, there are equations which give the number of photons per second collected by a telescope of a particular size from a star of a particular magnitude. A good source of these zero-point fluxes is Allen's Astrophysical Quantities. Some additional references are collected at the end of today's lecture. I use these values:
  Passband     photons/sec/cm^2
              from star of mag 0
---------------------------------
    U            550,000
    B          1,170,000
    V            866,000
    R          1,100,000
    I            675,000
Exercise:
- Ignoring atmospheric extinction, how many photons should strike a CCD in a 15-second exposure with the RIT 12-inch telescope through the V filter of a star with magnitude V=13?
How does the signal depend on exposure time?
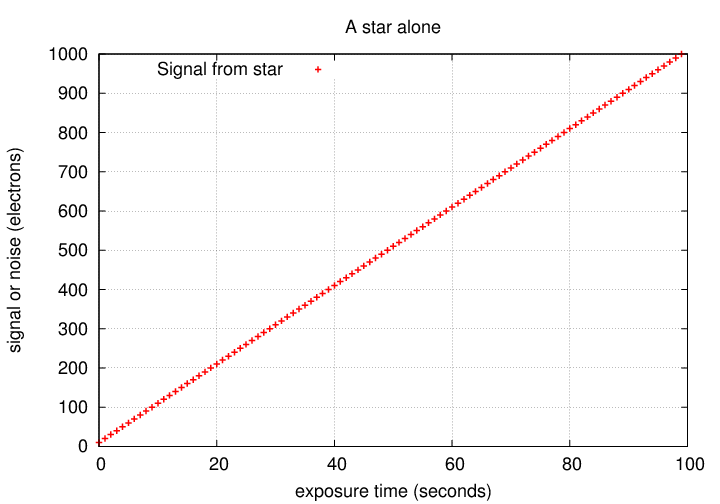
In a simple linear manner: if we expose twice as long, we get twice the signal. Great!
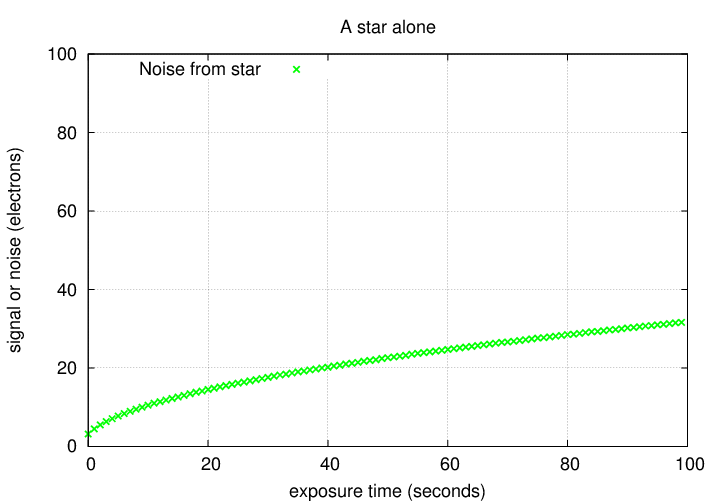
There are four main sources of noise for simple aperture photometry on a CCD: shot noise from the star itself, shot noise from the background sky, thermal noise from the CCD, and readout noise from the CCD. Let's consider each in turn.
        noise(star)  =  sqrt of number of electrons from star

                     =  sqrt[ N(star) ]
Let's look at the noise due to random fluctuations in the number of electrons liberated by starlight. How does it behave as a function of exposure time?
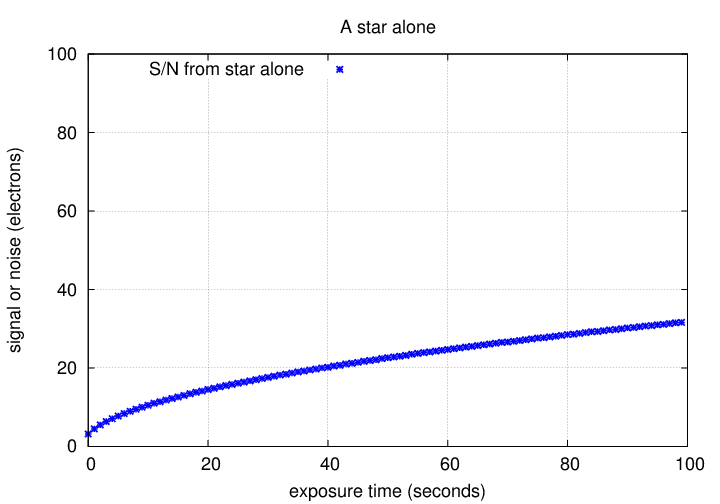
Okay. If we know how the signal and noise behave, we can compute the S/N for an isolated star measured with a perfect detector.
Exercise:
To measure the light from a star in a digital image, we need to draw a little circle around the star. For historical reasons, this circle is called the aperture.
When we add up all the electrons within the aperture, some may come from the star, but some will be due to this thermal contribution. If we take a series of dark exposures, we can measure the AVERAGE value of the dark current in each pixel ... but there will be random fluctuations around this average. We can subtract away the average value of this thermal contribution, but can do nothing about the random variations. Since thermal electrons also follow a Poisson distribution, the noise due to this random variation is
     noise(thermal)  =  sqrt of number of electrons from thermal motions

                     =  sqrt[ N(thermal)  ]
We can break this up into two factors:
the number of thermal electrons per pixel, and the number
of pixels in the aperture we're using.
N(thermal) = (electrons per pixel from thermal) * (number of pixels)
So we can write the thermal noise as
noise(thermal) = sqrt[ N(thermal per pixel) * npix ]
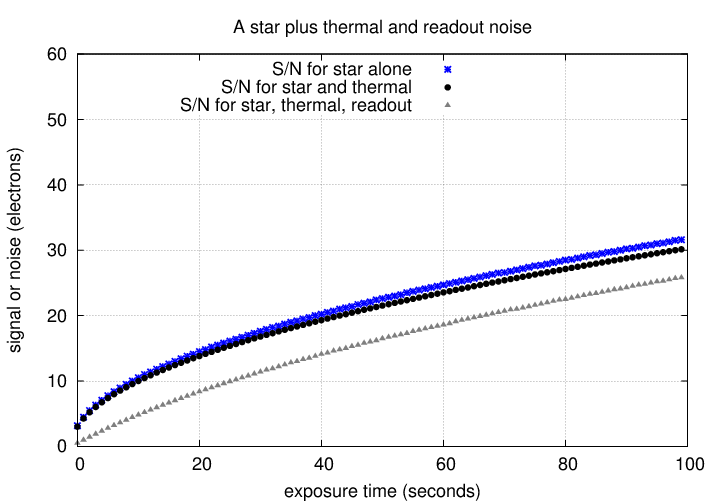
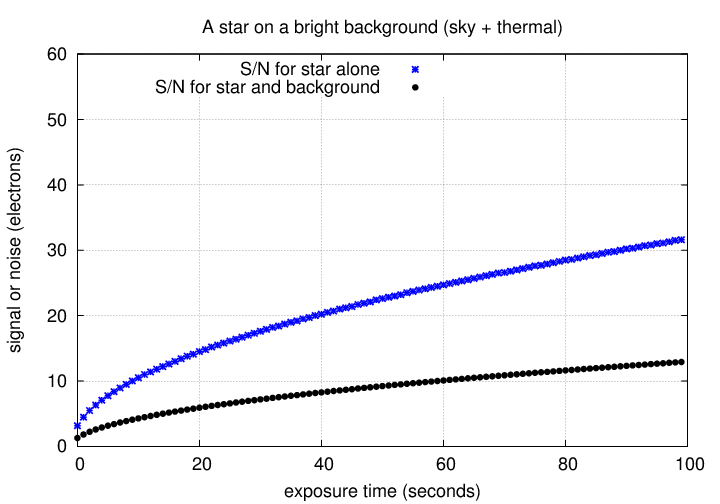
Let's look at a simple example: suppose that we are looking at a bright, isolated star in a perfectly dark sky. Then the signal from the star grows linearly, as usual. However, the number of thermal electrons also grows with time:
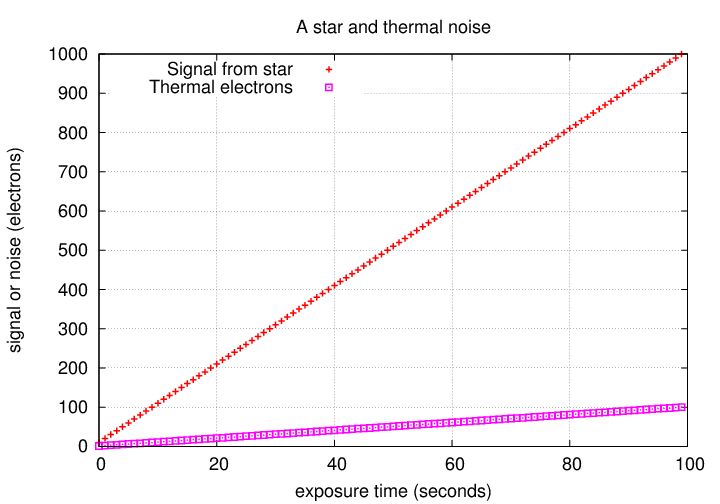
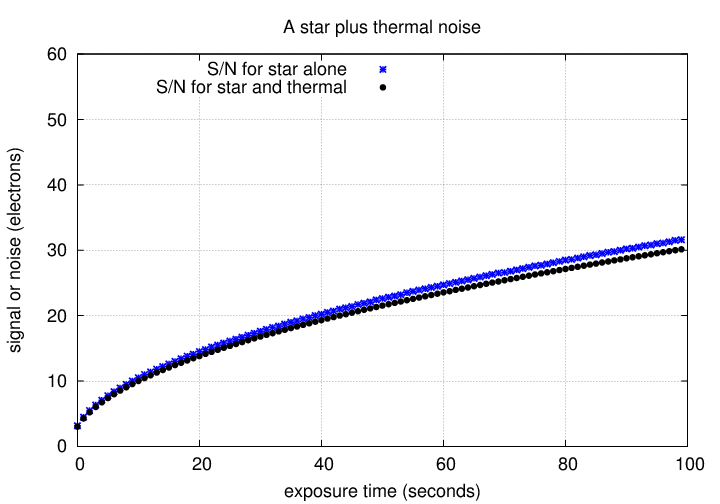
We now find two contributions to the noise, which behave in a similar fashion:
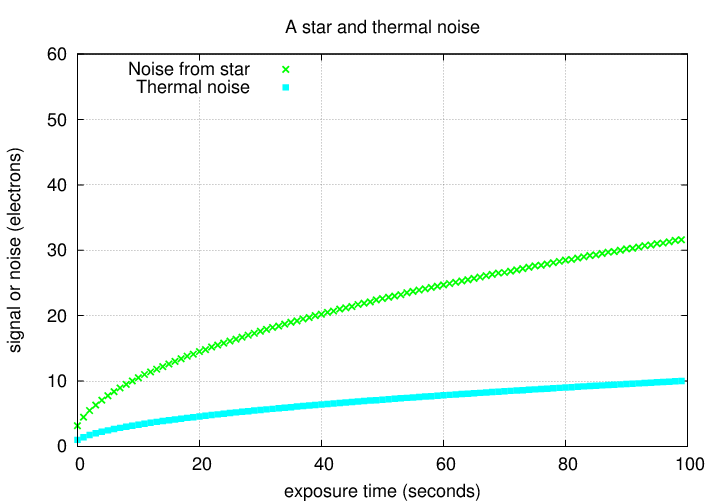
The signal-to-noise ratio will therefore be somewhat smaller due to the thermal noise.
                                           electrons
      readnoise R    =  stdev(counts)  *  ------------
                                             count
In our calculations of signal-to-noise, we need to convert from the stdev to the corresponding variance:
variance = (stdev * stdev)
and then add up the variance from all the pixels which fall
inside the photometric aperture. The result is
noise from CCD = (R*R) * npix
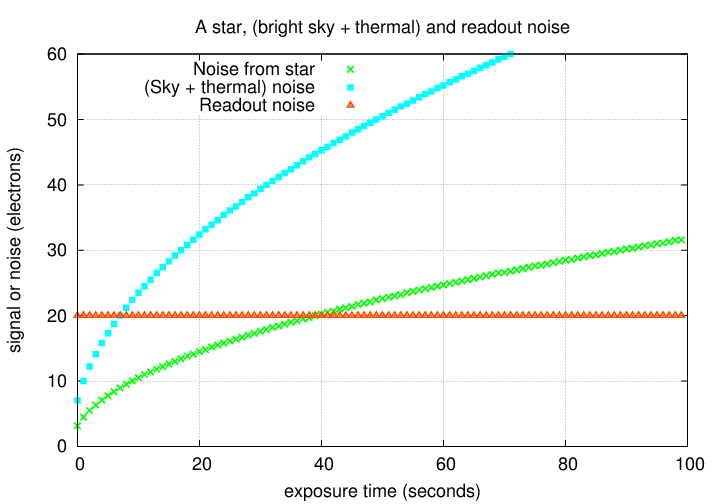
This source of noise behaves in a different way: it does NOT increase with exposure time.
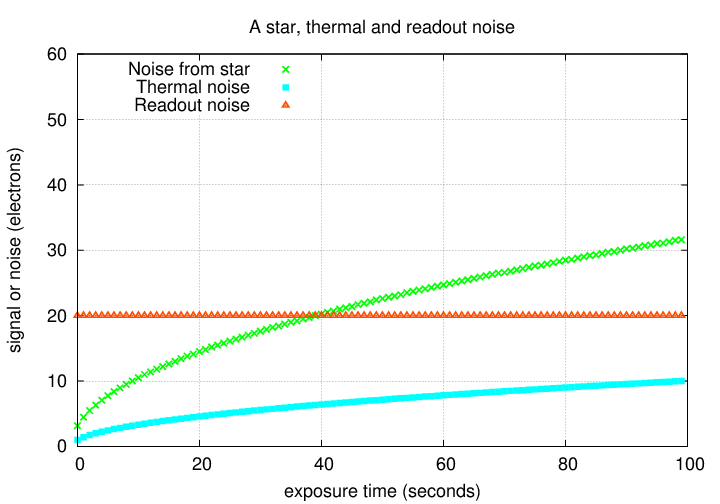
For very short exposure times, the readout noise can be the largest contributor to the "noise" part of the signal-to-noise ratio.
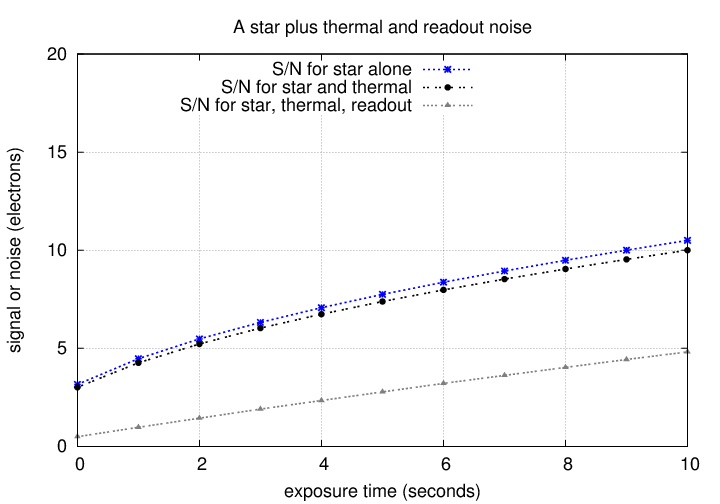
For long exposures, other sources of noise eventually dominate.
So, when we place an aperture around a star in an image,
we will integrate a mixture of electrons produced by light from the star, electrons knocked free by thermal motions, and electrons created by photons from these "background" sky sources. We can measure the amount of this "background" light by examining the pixel values in a region near the target object,
and then subtract the average value. However, just as the number of photons from a star varies randomly according to Poisson statistics, so does the number of photons from the sky. There is always some uncertainty in the amount of background light subtracted from the aperture. The noise due to this random variation is
        noise(sky)   =  sqrt of number of electrons from sky

                     =  sqrt[ N(sky)  ]
We can (again) break this down a bit further: to calculate the sky
contribution, we determine a local sky level per pixel,
and then multiply by the number of pixels within the aperture.
N(sky) = (electrons per pixel from sky) * (number of pixels)
So we can write the noise from the sky as
noise(sky) = sqrt[ N(sky per pixel) * npix ]
If the sky happens to be very bright -- or we choose a large aperture -- then the background might create even more electrons than photons from our target object.
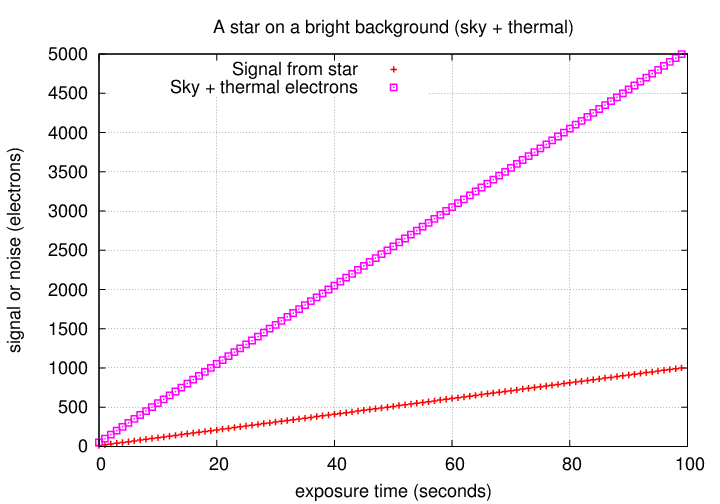
In that case, the noise might also be dominated by the background light:
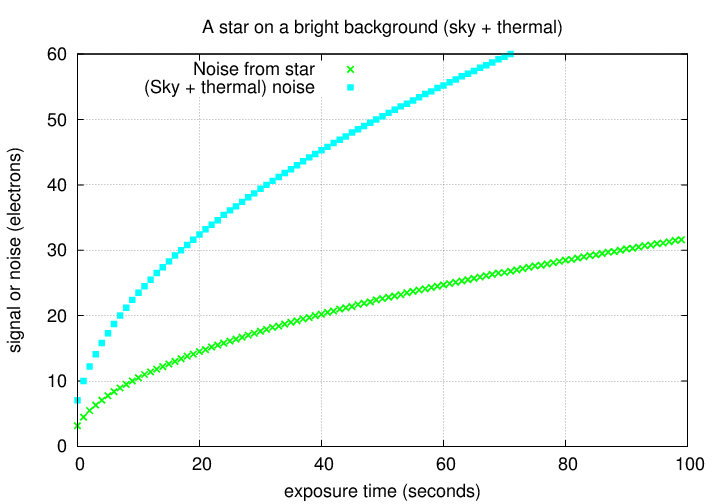
The overall S/N ratio would then be much lower than for the star on a perfectly dark background:
We can add all four sources of noise together: the way to do it is to add up all the electrons they produce, and then again appeal to Poisson statistics to find the noise.
    total noise      =   sqrt [ N(star)  +

                                N(sky per pixel)*npix  +

                                N(thermal per pixel)*npix  +

                                (R*R)*npix  ]
If we are looking at a faint star in a bright background, we might have noise contributions like
In order to find the S/N ratio, we simply divide the total signal by the total noise.
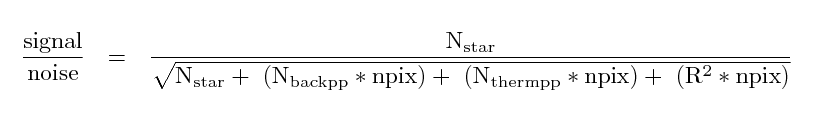
where
     N(star)                 is the number of electrons from the star
                                   which fall within the aperture

     N(backpp)               is the number of electrons Per Pixel
                                   due to the sky background

     N(thermpp)              is the number of electrons Per Pixel
                                   due to thermal effects

     R                       is the readout noise per pixel, in electrons

     npix                    is the number of pixels in the aperture
Remember to be consistent in your calculations. Always use electrons, in all the terms. It's easy to forget, and mix counts with electrons, but that will doom your work.
In the example above, we find a S/N ratio which grows with exposure time like so:
Consider the following situation.
Joe uses a small telescope, with diameter D = 20 cm, to observe a star in the Rochester skies. Just a few feet away, Alice uses a large telescope, D = 60 cm, to observe exactly the same star. Both Joe and Alice adopt a circular aperture of the same size; in Joe's images, the signal from the star is just about the same as the total number of electrons due to background sources within the aperture. Readout noise is small enough to ignore. If both take images with the same exposure time, how will the S/N of their measurements compare?
Note to readers: the following is a simplified version of the proper calculation, as we are pretending that each "count" in a digital image corresponds to one electron. As we will see next week, when discussing CCD gain, that is not necessarily true. In this particular case, each "count" corresponds to about 2.6 electrons.
You'll need to copy two particular images into your own directory for this exercise, $dd/signal/v585_clean.fit and $dd/signal/dark30.fit.

Exercise:
- Display the v585_clean.fit image. Measure the position of the bright star at lower right, near row=230, col=360.
- Define a box which includes the star, and is 10 by 10 pixels in size: you can type
box 1 cr=xxx cc=yyy nr=10 nc=10where you replace xxx by the row position of the star, and yyy by the column position of the star.
- Add up all the counts inside this box:
abx v585_clean.fit box=1Look at the "tot. adus" value for the total sum.
- Now define a box of the same size which does NOT include this star, or any star.
box 2 cr=zzz cc=www nr=10 nc=10where you choose the coordinates zzz and www to be the location of a blank region of the sky.
- Add up all the counts inside this other box:
abx v585_clean.fit box=2Call this the sky background. Assuming that each "count" represents one electron compute the number sky electrons per pixel. Let's also that this background assume is the same in both boxes (is that a good assumption?).
- Calculate the signal from the star inside the first box. Again, assume that each "count" represents one electron.
- Add up all the counts due to thermal motion inside the first box.
abx dark30.fit box=1Compute the number of electrons due to thermal motions per pixel.
- This image is binned 3x3 from the original larger image. The readout noise of 15 electrons per (normal) pixel thus corresponds to 45 electrons per (binned) pixel. You can use R = 45 electrons per pixel for the readout noise.
- Calculate the noise inside the first box. Please write down all these terms explicitly, before adding them together. What is the value of npix in this calculation?
noise = sqrt [ N(star) + N(sky + thermal per pix)*npix + (R*R)*npix ]
- Which of the noise terms is/are dominant? Which is/are negligible?
- Calculate the signal-to-noise ratio.
- Estimate the uncertainty, in magnitudes, of a magnitude measurement of the star from this image.
Now, let's see if we can figure out if the on-line signal-to-noise calculator yields a similar result. We need to know the magnitude of the star first, so let's use Aladin.
- Use Aladin to make a chart of the sky near V585 Lyr; use the POSS-I E image, 14.2 x 14.2 arcminutes in size.
- Choose the "UCAC4" catalog from the "Surveys" tab in Aladin (look to the right-hand side of the window). The star you have measured should have an entry in the UCAC4 catalog. What is its V-band magnitude?
- Use the XVista buffers command to look at the FITS header and determine the filter used in this picture.
- Now, use the on-line calculator to compute the expected signal-to-noise ratio for this star. Some values you might use are
What is the expected signal-to-noise ratio given by the calculator?
- telescope diam = 30 cm
- cheap CCD
- CCD readout noise 45 electrons
- sky brightness: suburbs
- airmass: 1.2
- radius for photometry: 10
- How does this value compare with the value you computed from the actual image itself?
You can see the actual scatter in magnitude measurements of this star by looking at this page describing V585 Lyr observations from Sep 20, 2003. The bright star you chose is the one marked "A" in the chart. Its scatter is indicated by the second dot from the left in the sigma-vs-mag diagram. You can see closeups of the magnitude measurements ...
Did we make any assumptions in our calculations that might cause a difference in the results?
It is not uncommon for the measured scatter of a star, based on a series of measurements, to be somewhat larger than the estimate based on pure statistical grounds.
Copyright © Michael Richmond.
This work is licensed under a Creative Commons License.