 Copyright © Michael Richmond.
This work is licensed under a Creative Commons License.
Copyright © Michael Richmond.
This work is licensed under a Creative Commons License.
Contents
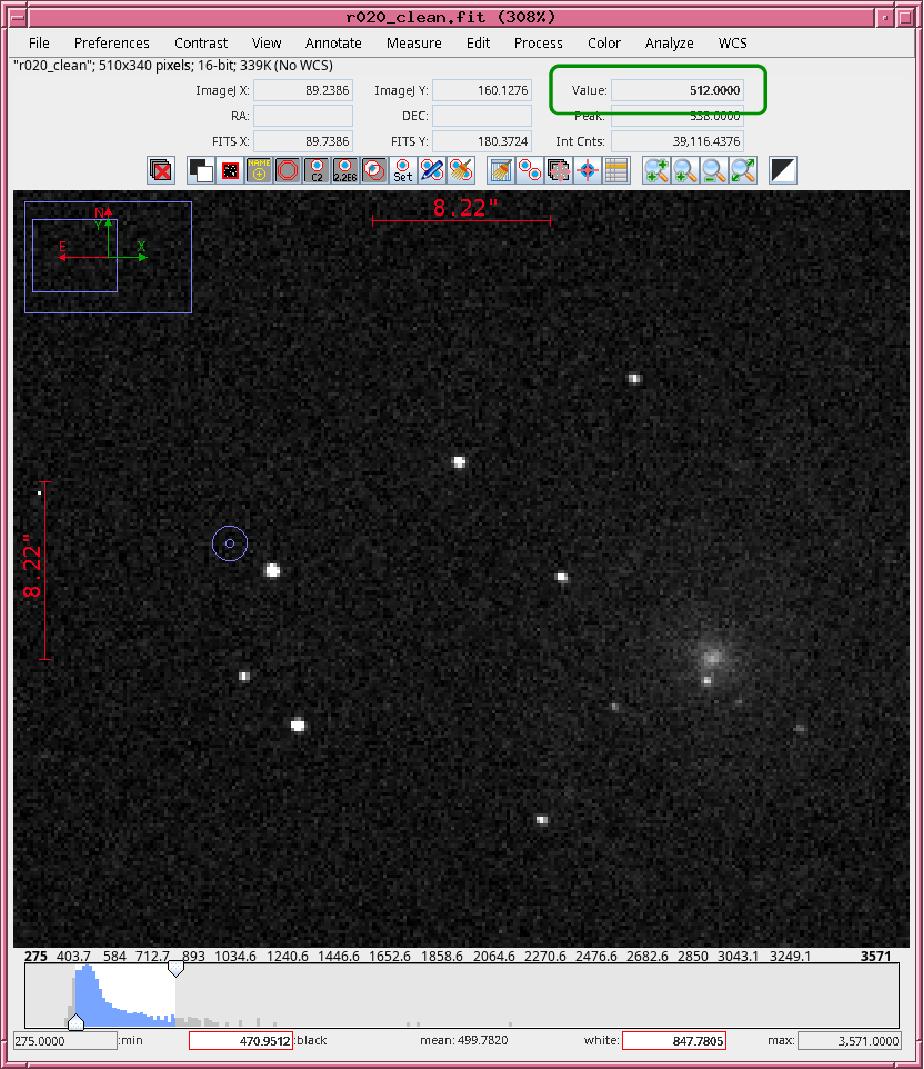
Our goal today is to measure the brightness of some stars in the field of the nearby spiral galaxy M74. We can use these images taken at the RIT Observatory.
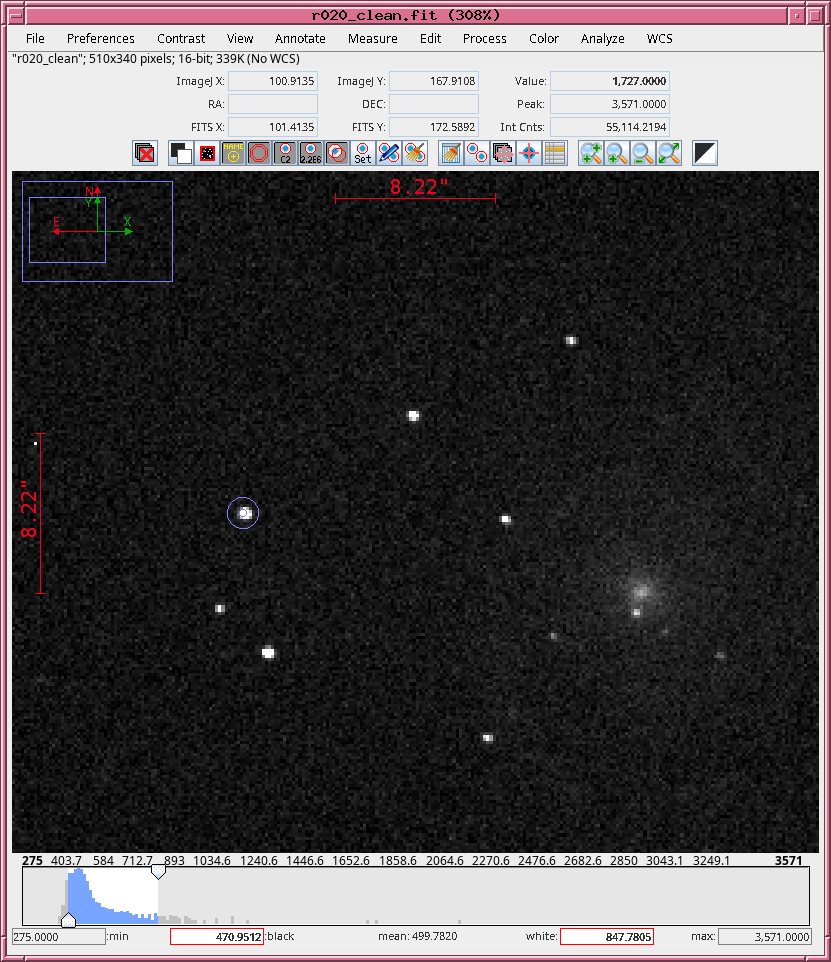
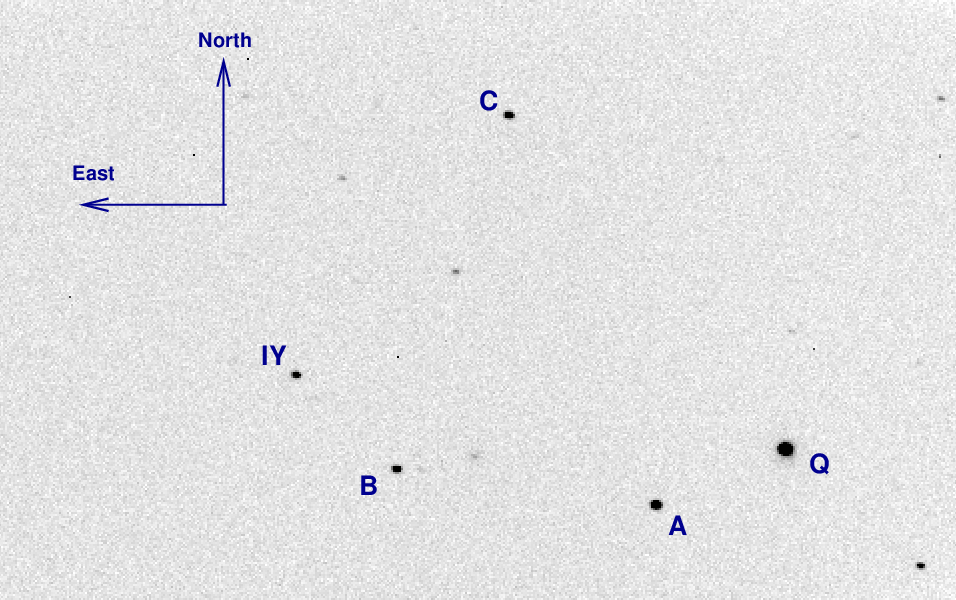
Each should look something like this:
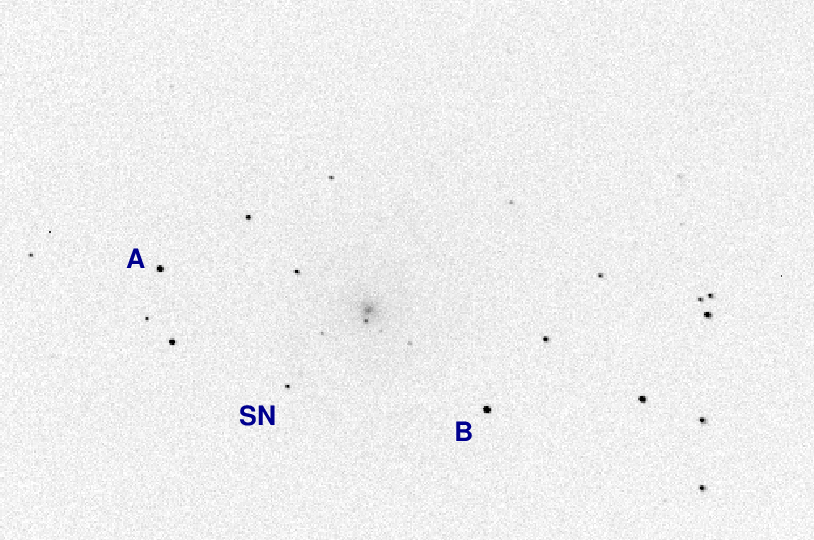
I've labelled a few objects for future reference.
Now, if you look at the image above, it should be obvious that the star "A" is much brighter than the object labelled "SN" (which is actually SN 2013ej). The question is: exactly how much brighter is it?
One obvious method to answer this question is simply to measure the brightest pixel in each object, subtract away the sky contribution from the value -- and that's it. In other words,
result = peak - sky
It's quick and easy ... but not very accurate.
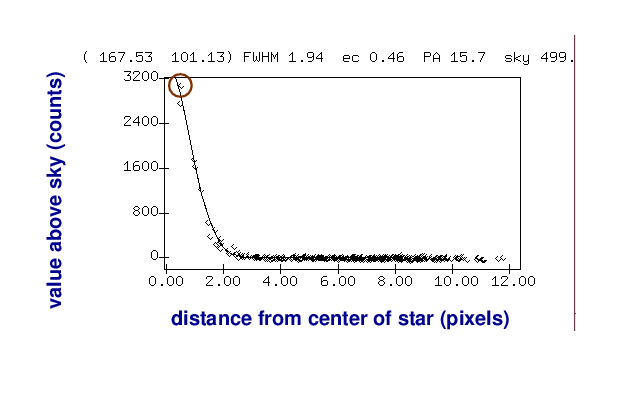
We can illustrate this method with a radial-profile graph of the star. On the horizontal axis is the distance of each pixel away from the center of the star, and on the vertical axis is the pixel value above the local sky value.

So, our simple method is just to pick the largest pixel value in this graph:
As you can imagine, this isn't very accurate for several reasons. Depending on the exact position of the star on the CCD, the peak of the point-spread-function (PSF) might fall at the center of the pixel, or near the edge, or even near the corner; the amount of light recorded by that pixel would vary in each case.
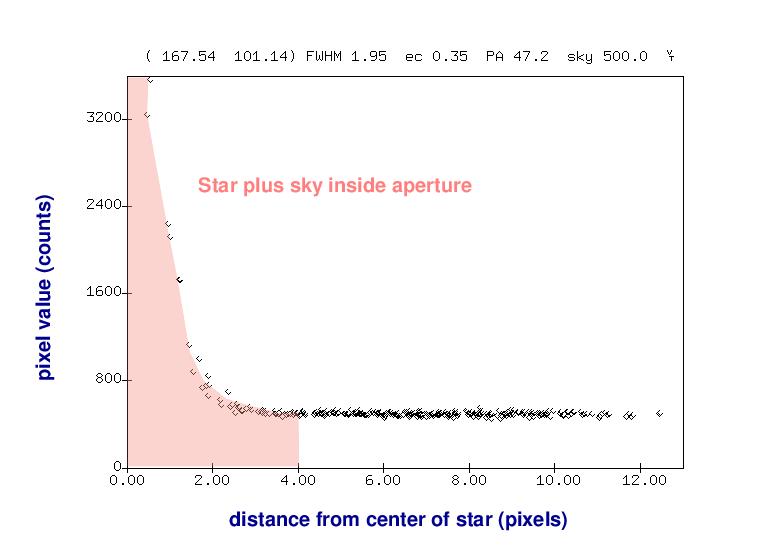
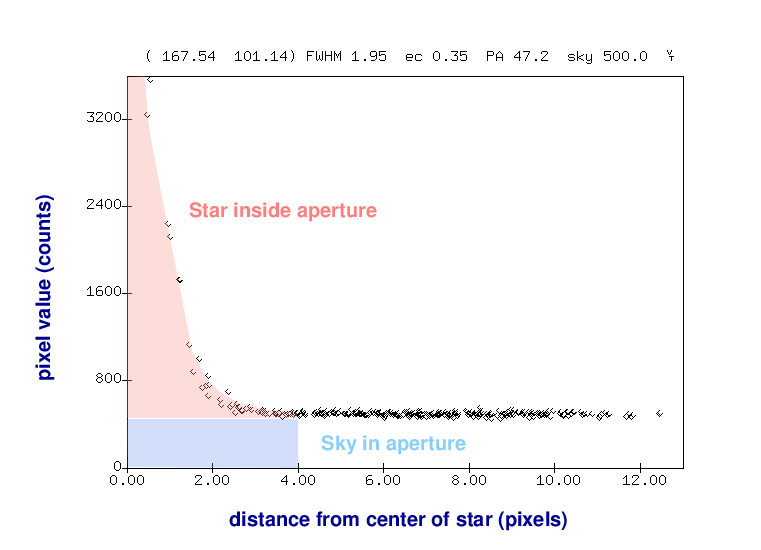
A better approach is to add up all the light which falls onto the CCD within a small region around the center of the star:

Of course, that will mean that we include some light from the sky as well.
But we can then use an annulus around the star to measure the typical sky value, without any contamination from the star's light.
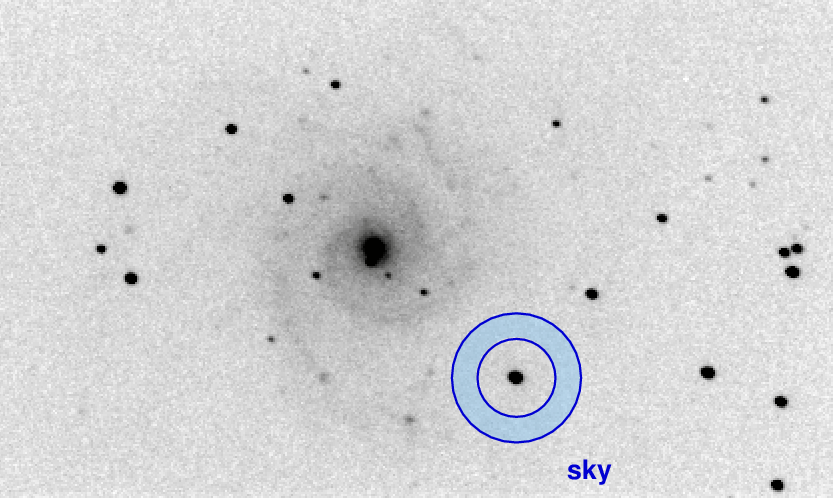
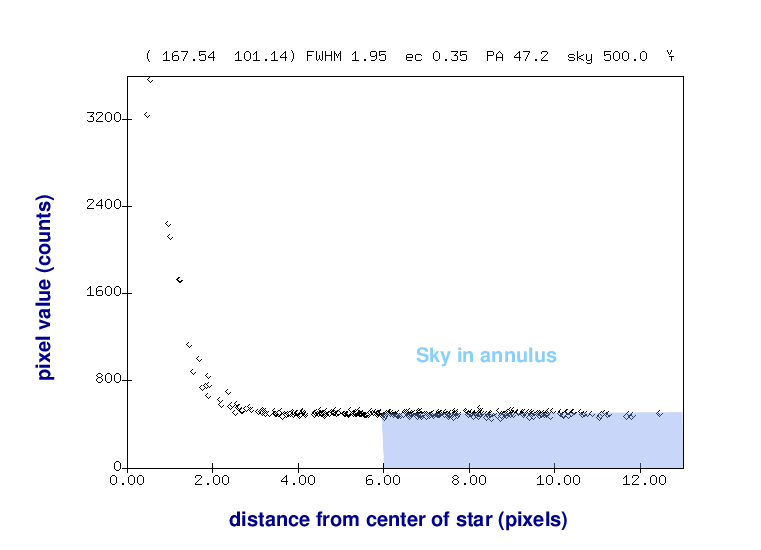
Once we know the local sky value, we can go back to our measurement of light inside the aperture and remove the contribution from the sky -- leaving a good measurement of the light from the star, all by itself.
Okay, let's try this method. First, we'll do the arithmetic MANUALLY (in just a few minutes, we'll see a quicker and easier way to let the computer do more of the work). Use AstroImageJ to open the first image of M74:
Choose the Aperture Photometry Tool from the AIJ command window.
![]()
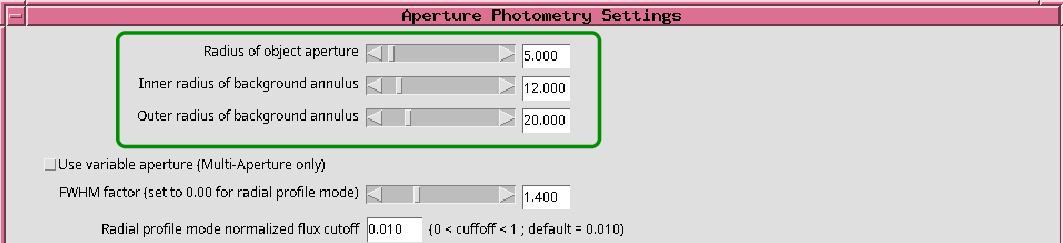
Then right-click while pointing at this icon to bring up the Aperture Photometry Settings window.
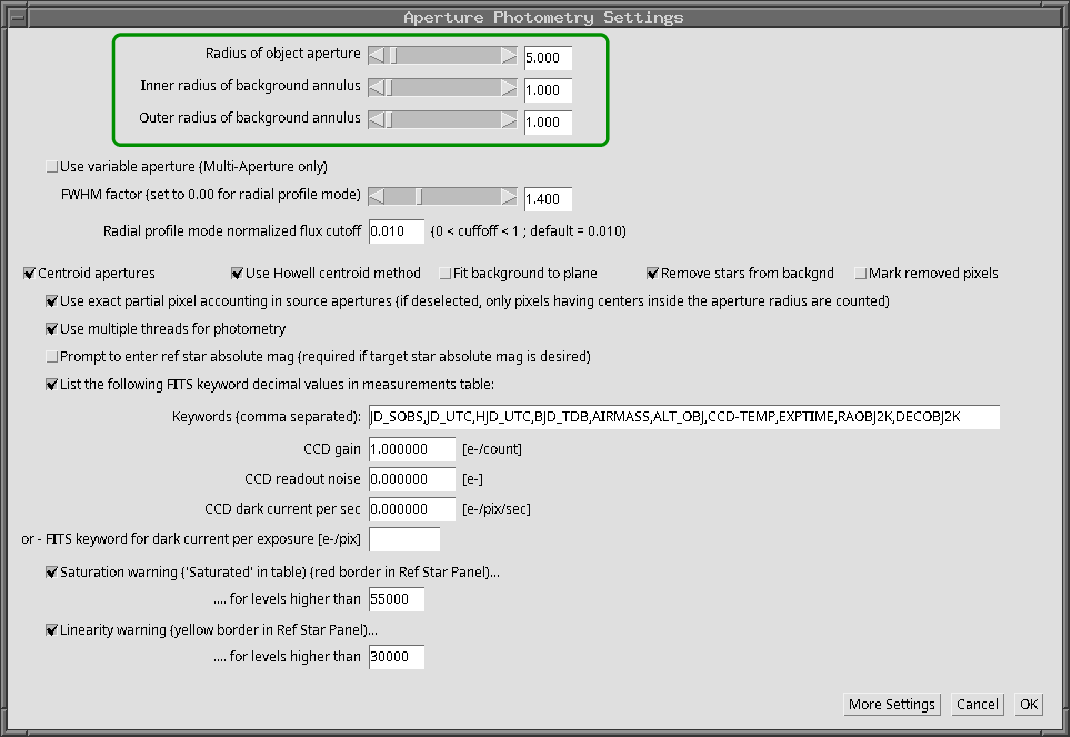
Use the three sliders in the section highlighted by the green box to make sure that the values are
This will prevent AIJ from making any corrections for the background pixel values; you will have to perform that job for now.
We are interested two stars, labelled "A" and "SN".
counts_A = ("A" plus sky in aperture) - [ (sky value nearby) * 78 pixels ]
Now repeat to measure the brightness of the SN.
counts_SN = ("SN" plus sky in aperture) - [ (sky value nearby) * 78 pixels ]
And now you are ready to compute the difference in brightness between the SN and star "A", in magnitudes.
(mag SN) - (mag A) =
Stop at this point, so we can compare this difference in magnitudes as measured by several students.
There's a quicker and more accurate way to make this type of measurement in AstroImageJ. Go back to the Aperture Photometry Settings window, and modify the values in the highlighted region to match those shown below.
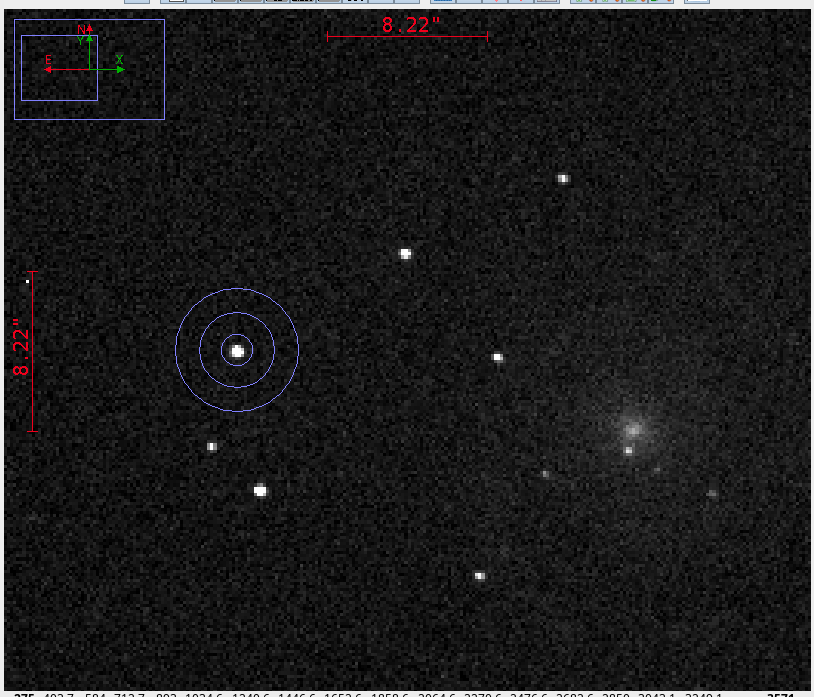
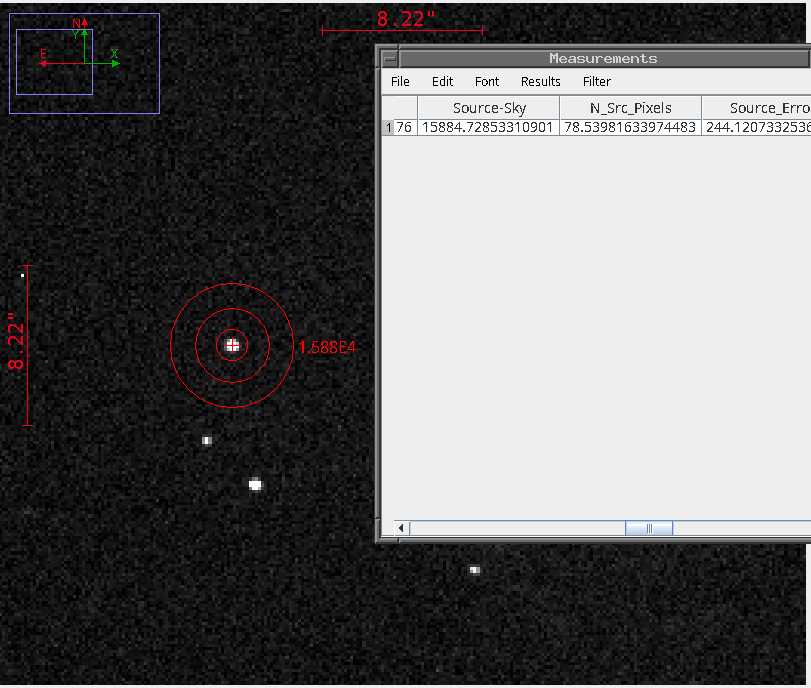
Now, when you move the cursor to a star in order to perform aperture photometry, you should see three circles: the smallest is the aperture itself, while the middle and largest circles mark the inner and outer radii of the sky annulus.
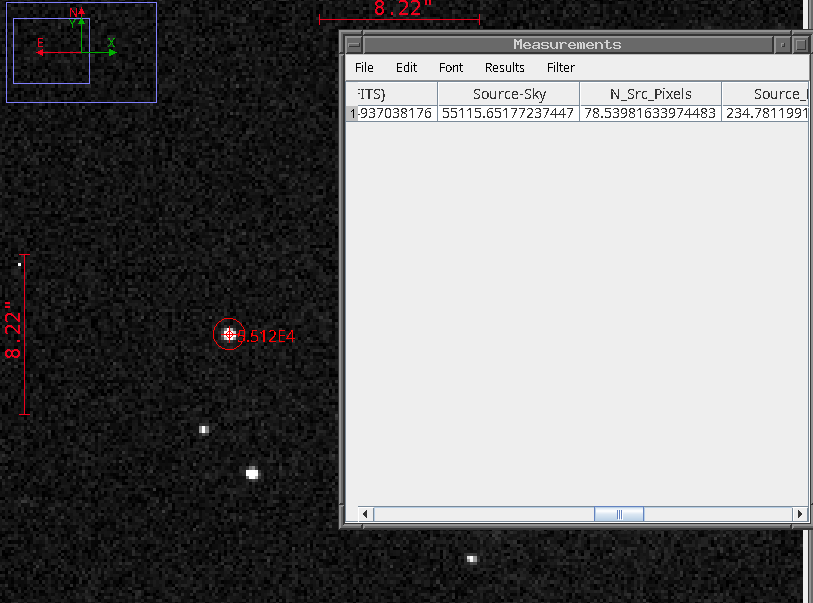
Left-clicking on a star will now produce, in the "Source - Sky" column, a record of the number of total counts inside the aperture, MINUS the number of estimated sky counts inside the aperture; the result should be the contribution of the target star alone.
Using this new technique, measure the number of counts from stars "A" and "SN". Once again, compute the difference in magnitude between the two:
(mag SN) - (mag A) = (annulus version)
How does this value compare with your earlier one?
Stop at this point, so we can again compare this difference in magnitudes as measured by several students.
Let's practice by making measurements of three objects in the field of the variable star IY UMa , which is at RA = 10:43:56.73, Dec = +58:07:31.9 (J2000).
You can download FITS images of this field from one of my courses, if necessary:
Use aperture photometry to measure the instrumental magnitudes of the stars "A", "B", and "IY". Choose
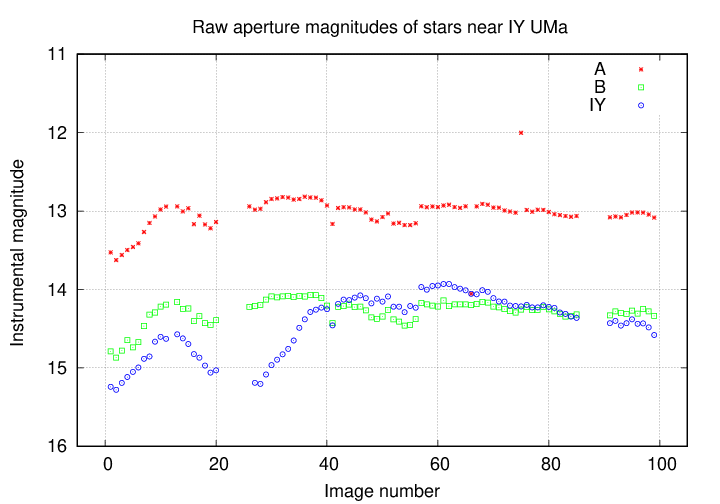
Convert the number of counts from each star into an instrumental magnitude using the formula
mag = 25.0 - 2.5*log(Source - Sky)
We'll break up the big list of images into small sets of 5 or 10 per person, so that this doesn't take too long.
When you have finished, make a table that looks something like this:
image        A       B         IY
1          12.592   13.670   13.079
2          12.612   13.642   13.091
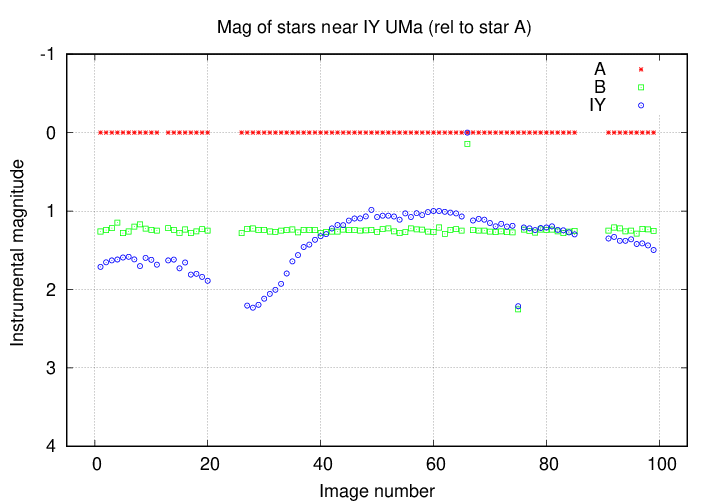
When everyone has finished, I'll make a light curve of these stars by graphing the instrumental magnitudes (on the vertical axis) against the image numbers (on the horizontal axis).
![]()
http://spiff.rit.edu/classes/phys445/work/apr11_2006/You should find 99 images, each a simple 16-bit integer FITS image, 510-by-340 pixels in size.
Copyright © Michael Richmond.
This work is licensed under a Creative Commons License.