 Copyright © Michael Richmond.
This work is licensed under a Creative Commons License.
Copyright © Michael Richmond.
This work is licensed under a Creative Commons License.
Your project this semester will involve measuring the changes in brightness of a star over at least one, if not several, cycles. You have chosen stars which are already pretty well studied, so you could just look up their periods in a catalog. However, astronomers have found that the periods of some stars change over timespans of years to decades. It's possible that the period listed in a catalog, which may have been measured 20 or 30 years ago, is no longer accurate.
It would be a very good idea for you to determine the CURRENT period of your star using only the measurements you acquire yourself in the year 2022. But what is the best way to measure the period of a variable star?
Today, I'll describe several aspects of this common problem. We'll start by looking at small sets of measurements coverting just a few crucial portions of the period, then graduate to methods which deal with longer stretches of data.
Suppose we are interested in a star which clearly varies in a regular manner; one example is called ASAS 002511. You can download its light curve on Sep 19.
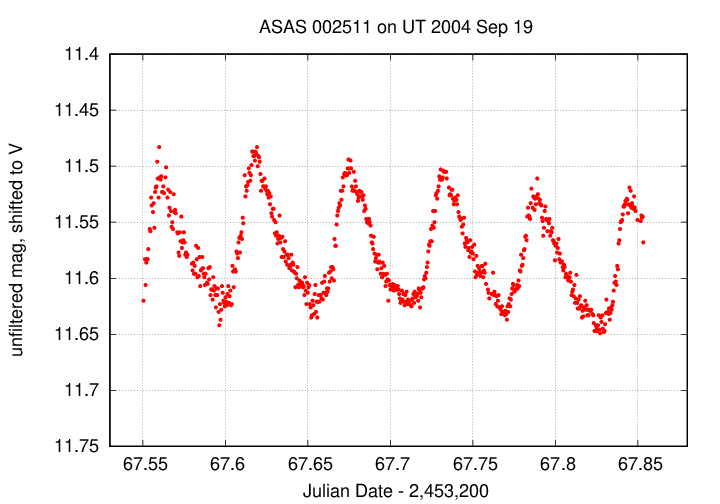
One very simple way to measure the period of this star is to determine the time of two adjacent minima. Let's zoom in on one section of the data:
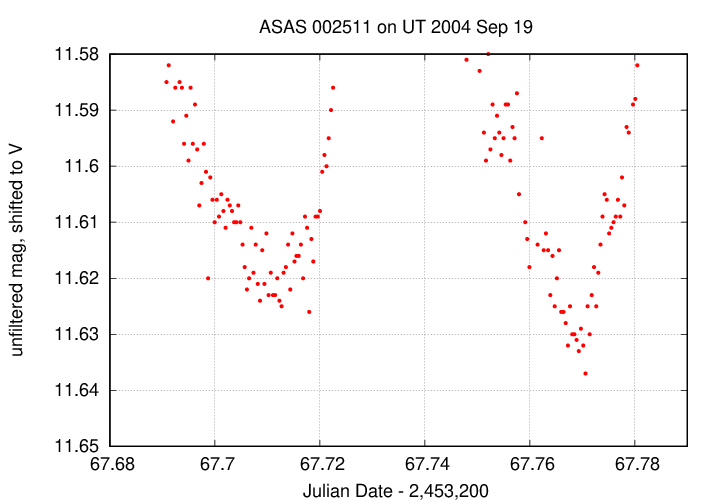
At what time does each minimum occur? Hmmmm. How could we measure it?
  Q:  What is the time of the first minimum in this closeup?

  Q:  What is the time of the second minimum in this closeup?

  Q:  What is the period based on these two minima?
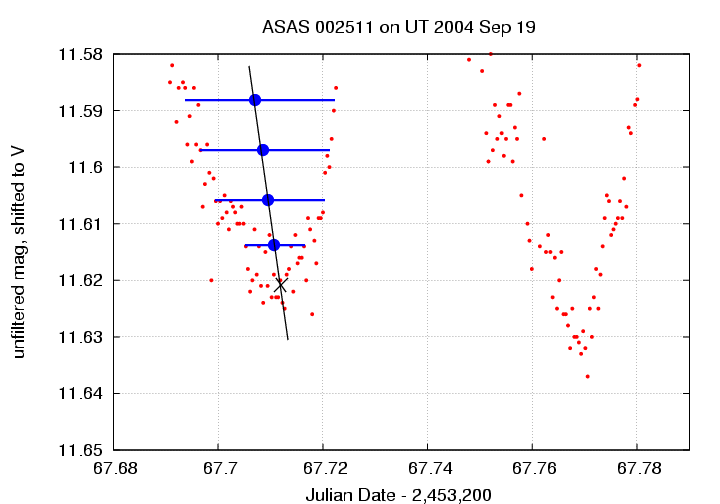
How accurate is this period, based on measurements over just one cycle? Well, let's find out: we'll predict the time of an event in the future.
  Q:  Start with the time of the minimum shown at right
         in the closeup above.  Using your period, predict when exactly
         16 (sixteen) more cycles should have just finished,
         so that the light curve is at a minimum again.
Now, look at the figure below, which shows measurements of the star on the following night. You can find these measurements of ASAS 002511 on Sep 20 UT in this datafile.
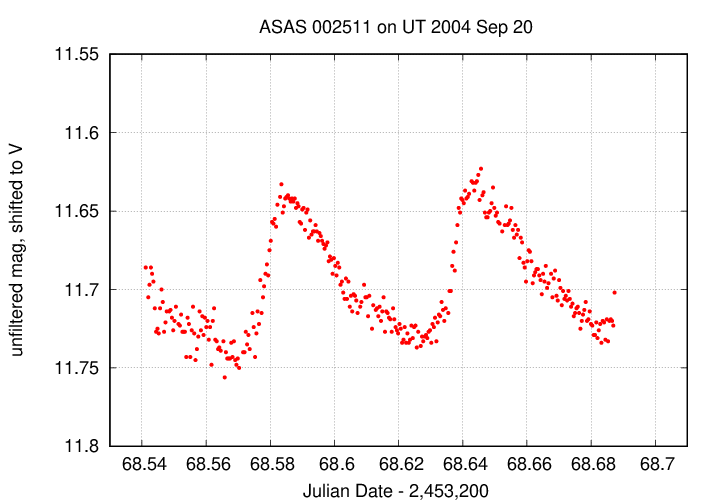
  Q:   At what time does the sixteenth cycle actually finish?


  Q:   Can you use this time to improve your estimate of the period?
The great thing about truly periodic signals is that one can improve one's estimate of the period by watching for a long time and counting many cycles. The planet Saturn, for example, has been observed and measured accurately by humans for hundreds of years. The JPL Horizons system has this value for its period:
Saturn: Sidereal orbit period = 29.447498 yr
That's a lot of significant digits!
In practice, one may lack continuous coverage of a star over several consecutive cycles. For example, consider a student plagued with bad weather, who can make just one measurement each night -- and only on some nights.
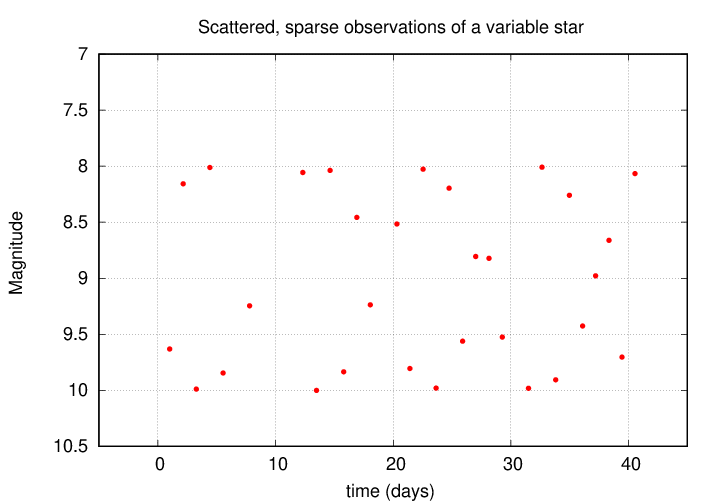
Don't despair -- it is still possible to determine the period of this star. We just have to use other methods ...
Consider a very simple periodic signal:
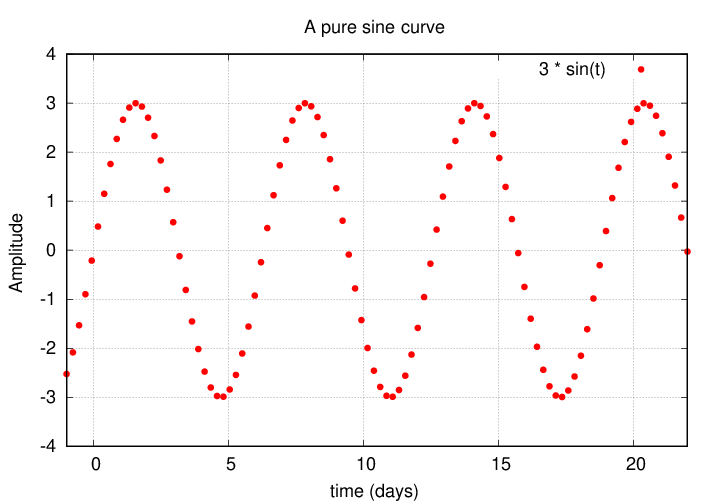
A sine wave described by
                                       2*pi
      y  =  3 * sin( t )  =  3 * sin( ------ t )
                                        P
We can describe this signal with two parameters:
If we have a very long stretch of data, and we plot the signal versus time, we end up with a very long graph:
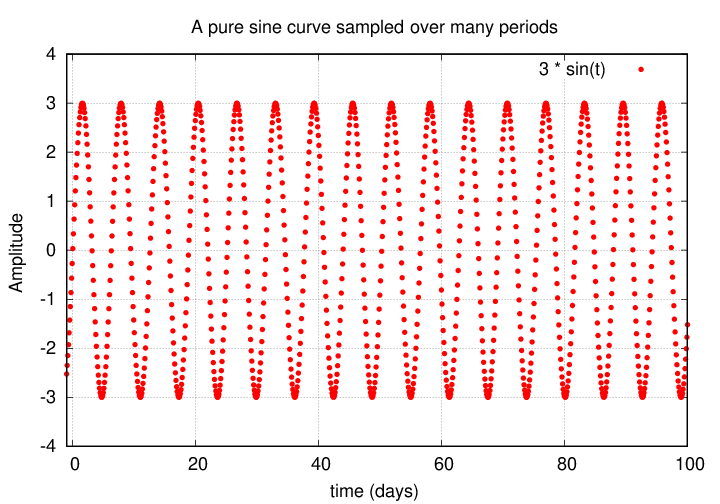
It is possible to squish a very long stretch of data onto a small graph if one converts the time variable to a related quantity: phase. Phase is defined as the fractional portion of the number of periods which have elapsed at a given time:
                                                       t
     phase at time t  =  fractional portion of  (  ---------  )
                                                     period


                              t                    t
                      =    --------  -   int (  ---------- )
                            period               period
The phase ranges over a fixed, small range:
If we take that same sine curve as before, with data running from time t=0 days to t=100 days, and this time plot its value versus phase, we get a very simple graph:
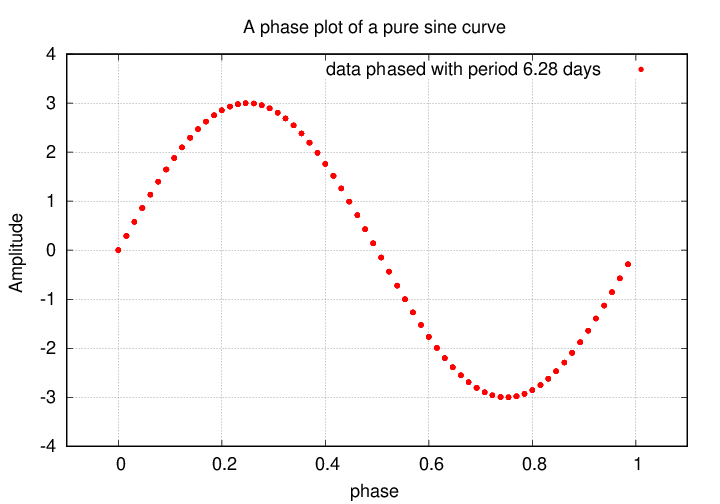
This has nice features:
As you will see below, we can use phase diagrams to figure out the period of an unknown signal.
What happens if we try to calculate the phase of a signal, but do so with the wrong period? Once again, we'll use a simple sine curve to illustrate. But this time, we'll calculate the phase with a period slightly different from the true value. Instead of a period of 6.28 days, we'll use a period which is just 2 percent larger: 6.41 days. When we plot the points in a phase diagram, we see this:
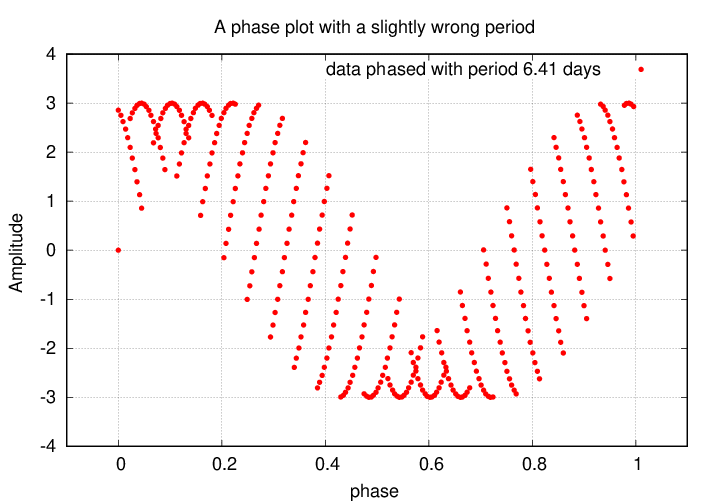
Hey! The phased data no longer lie along a single, smooth locus in the diagram. Instead, they form a wide band. This is a signal that the period used to calculate the phase was incorrect.
If we use a period which is far from the true value, the phased data scatter all over the diagram:
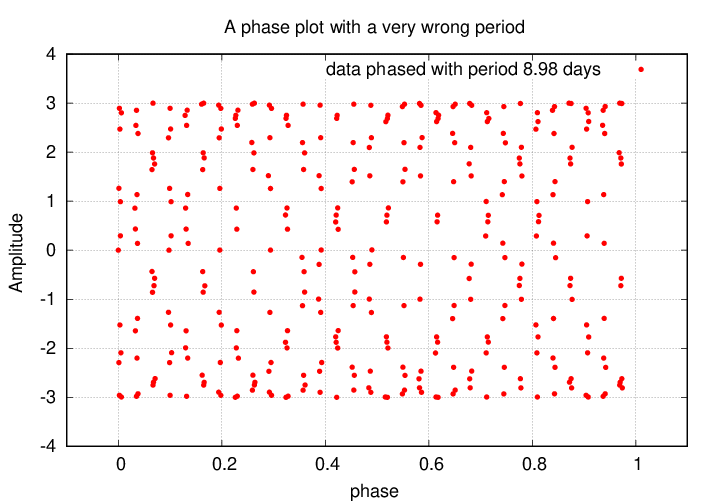
Only if the proper period is used to calculate the phase will the data fall along a single, narrow path in the phase diagram. We can use this fact to determine the period: pick a period, calculate the phase, and plot the resulting phase diagram. Modify the period and repeat until the points fall along a narrow locus.
Let's try that method with the sparse measurements mentioned earlier. Here they are again, in graphical form ...
and in tabular form, like this:
     day       mag

   1.003 ,  9.631
   2.155 ,  8.157
   3.267 ,  9.989
Can you find the period? Try the following exercise.
- Use a spreadsheet program to create a new column of numbers, based on the "day" column.
- Guess an initial period, in days, and then compute for each measurement
phase = (day / period) - INT(day / period)Then plot the "mag" column versus the "phase" column. How does your phased light curve look?
- Modify your initial guess at the period and replot the light curve. Can you find a period which yields a smooth, continuous light curve?
This isn't the only way, or the best way, to determine the period of a variable star. It is pretty simple, though, and so it's not a bad idea if you can't find something more sophisticated.
If you are interested in other techniques, take a look at the for more information section below.
Suppose that we have measured a variable star very well during the summer of 2021 ...
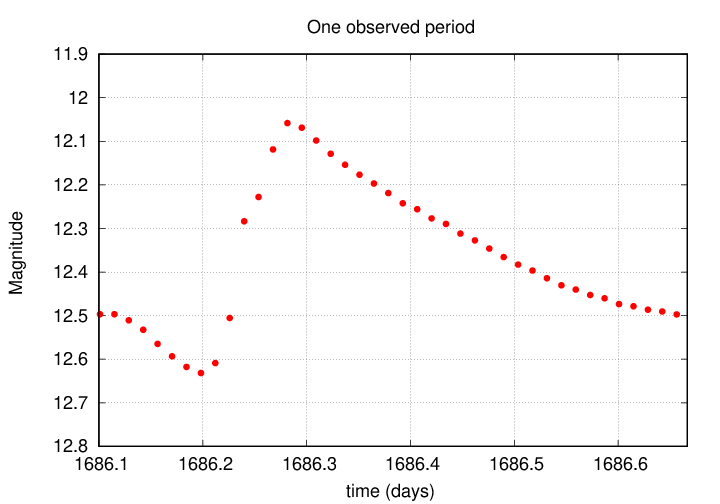
... so well that we have a good estimate for the period P; in this case, P = 0.56686776 days . Let's determine the exact time when the minimum light occurred during this particular cycle.
Q: Look at the graph above. What was the time of minimum light?
Right. The minimum brightness occurred at a time of t0 = 1686.20.
We can put these two pieces of information together to create an ephemeris, which we can use to predict the time of any future minimum brightness.
    Calculated time of minimum  C    =   t0        +  n*P

                                C    =   1686.20   +  n*0.56686776
  Q:   Predict the time of minimum brightness for n=3 cycles in
           the future.
Right. Our calculated time of minimum is 1687.9006.
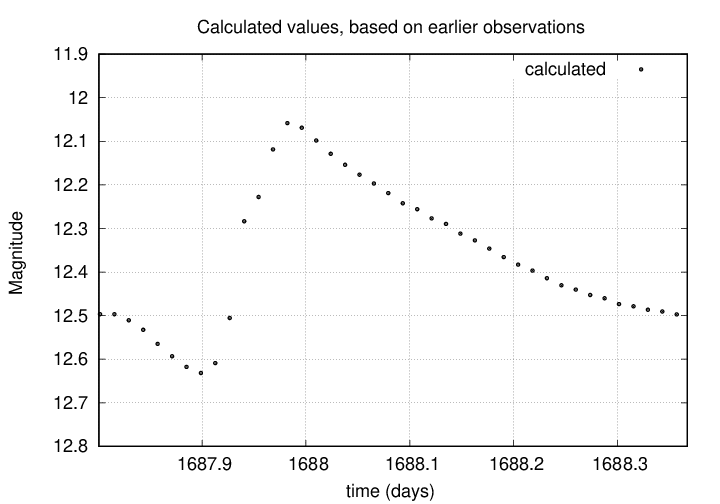
Now, if our estimate of the period was accurate, and if the period of the star remains constant, and if there's no funny business, we ought to see the star reach a dip in its brightness at this time. And, usually, that's what we see.
But sometimes, our observations don't exactly match the calculated time of minimum.
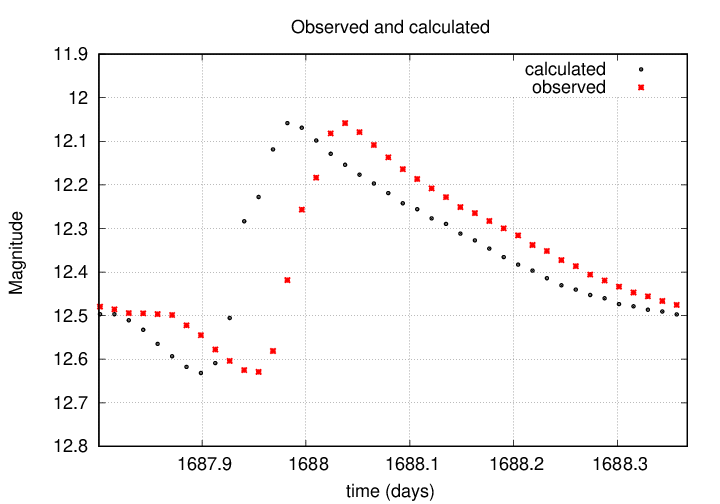
In cases like this, we can define a difference between the OBSERVED and CALCULATED times of minimum; astronomers call this difference (O-C).
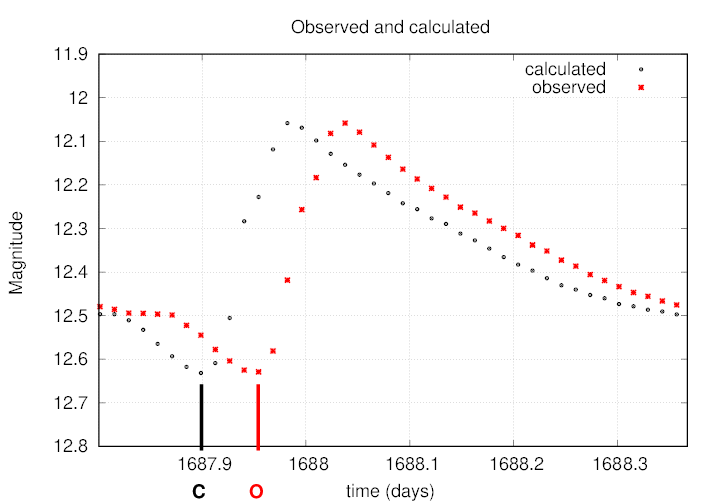
Q: In this case, what is (O-C)?
Exactly. For this example, we can read from the graph a rough value of (O-C) = +0.05.
Now, in this example, we could see an obvious difference after just three cycles. That's very unusual. In real life, astronomers usually have to wait for YEARS in order to start noticing a significant offset between the predicted and observed times of minimum. But patience can be richly rewarded, as the careful study of these offsets over long periods of time can reveal a number of useful and interesting bits of information.
Why would the period change? In the case of a pulsing star, detailed chemical or physical properties of the outer atmosphere might be evolving. In the case of an eclipsing binary star, a changing orbital period may be the sign of mass being transferred from one star to the other, or lost from the system altogether in a strong stellar wind.
Jeff Robertson of Indiana University gave a very nice list of references for period-finding techniques in an E-mail to VSNET (vsnet-chat 131), which I reproduce below:
-----------------

An old but nice introduction and review to the four or five most popular period
finding methods can be found in [1] by Fullerton. This includes the various
"string-length" methods made popular by Lafler and Kinman [2]. This method has
been expanded upon by Stellingwerf [3] with the PDM method which is now a part
of IRAF. Most of the people I am associated with use FFT methods as prescibed
by Horne and Baliunas [4] and can now be found in the Numerical Recipes [5]
book. There is also a DFT method [6] which I am not to familiar with.

I am also interested in anyone else's methods and ideas...

References:
1. The Study of Variable Stars Using Small Telescopes, Fullerton, A.W. 1986,
   ed. J.R. Percy, Cambridge University Press, p 201-218.
   (This book can be found in the University of Rochester library system)

2. An RR Lyrae Survey With The Lick 20-inch Astrograph II. The Calculation
   An RR Lyrae Survey With The Lick 20-inch Astrograph II. The Calculation
   of RR Lyrae Periods By Electronic Computer, Lafler, J. and Kinman, T.D.
    ApJS 11, p 216-222.

3. Period Determination Using Phase Dispersion Minimization (PDM),
   Stellingwerf, R.F. 1978,  ApJ 224, 953-960.

4. A Prescription for Period Analysis of Unevenly Sampled Time Series,
   Horne, J. and Baliunas, S. 1986,  ApJ 302, 757-763.

5. Search Algorithm For Weak Periodic Signals In Unevenly Spaced Time-Series,
   Press, W.H. and Teukolsky, S.A., Numerical Recipes, Cambridge Univ. Press.

6. Time Series Analysis with Clean - Part One - Derivation of a Spectrum,
   Roberts, D. H., Lehar, J., Dreher, J. W.,
   1987,  AJ, 93, 968.

   which is illustrated in practice here ...

   Discovery of a possible X-ray triple - 4U 1915-05,
   Grindlay, J. E., Bailyn, C. D., Cohn, H., Lugger, P. M., Thorstensen, J. R.,
   Wegner, G., 1988,  ApJ, 34L, 25
 -------------------
You can find some tools to analyze stellar light curves on-line.
The star used as an example near the start of this lecture, ASAS 002511, is a cataclysmic variable.
Copyright © Michael Richmond.
This work is licensed under a Creative Commons License.