 Copyright © Michael Richmond.
This work is licensed under a Creative Commons License.
Copyright © Michael Richmond.
This work is licensed under a Creative Commons License.
You have analyzed data on your target gathered at the RIT Observatory, but it might help to add additional measurements taken by other telescopes. Below are shown guides to acquiring data from archive sites; perhaps you could use these methods to improve the analysis of your star.
The Transiting Exoplanet Survey Satellite (TESS) was launched in 2018 and has spent its time in space (four years so far) making repeated measurements of the brightness of millions of stars. It spends roughly 30 days on one "sector" of the sky, then moves on to another sector. Durign the course of one year, it scans half the sky -- either the northern or southern celestial hemisphere. After it completes this scan, it switches to the other hemisphere and begins scanning again.
In many cases, TESS can provide very precise light curves for star over the course of about 30 days. We'll use the star RR Lyrae in this example, but you can follow the same steps for your star.
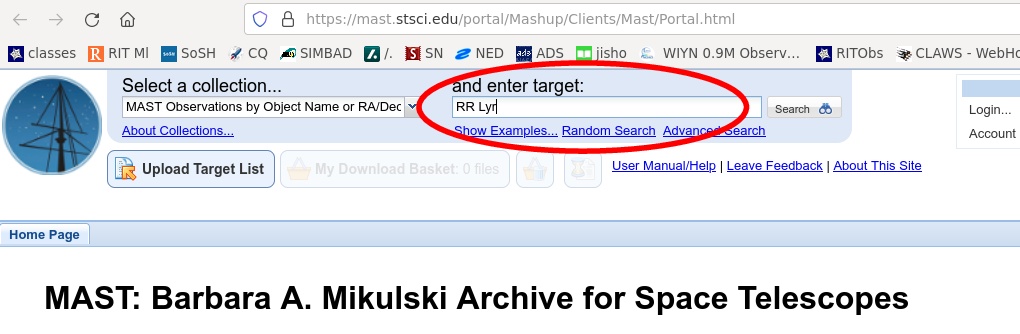
First, go to the
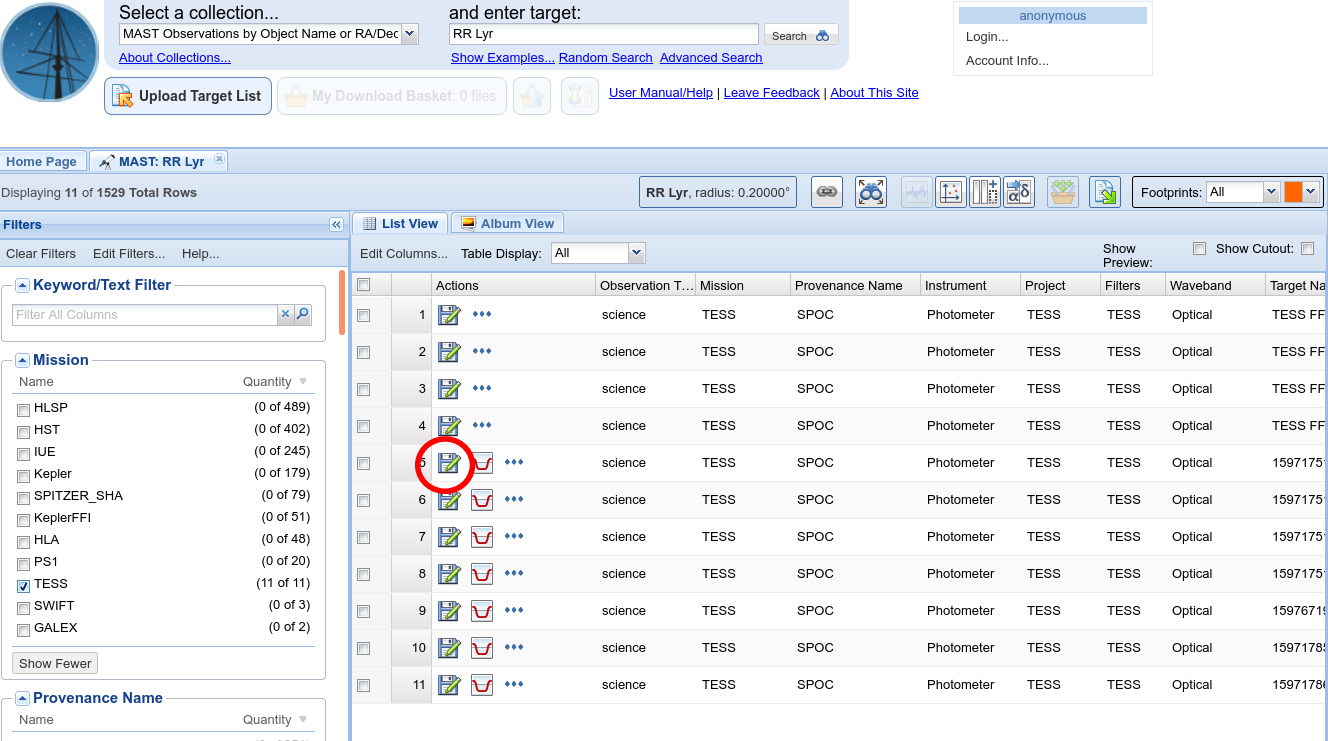
and type the name of your star into the "and enter target" box.
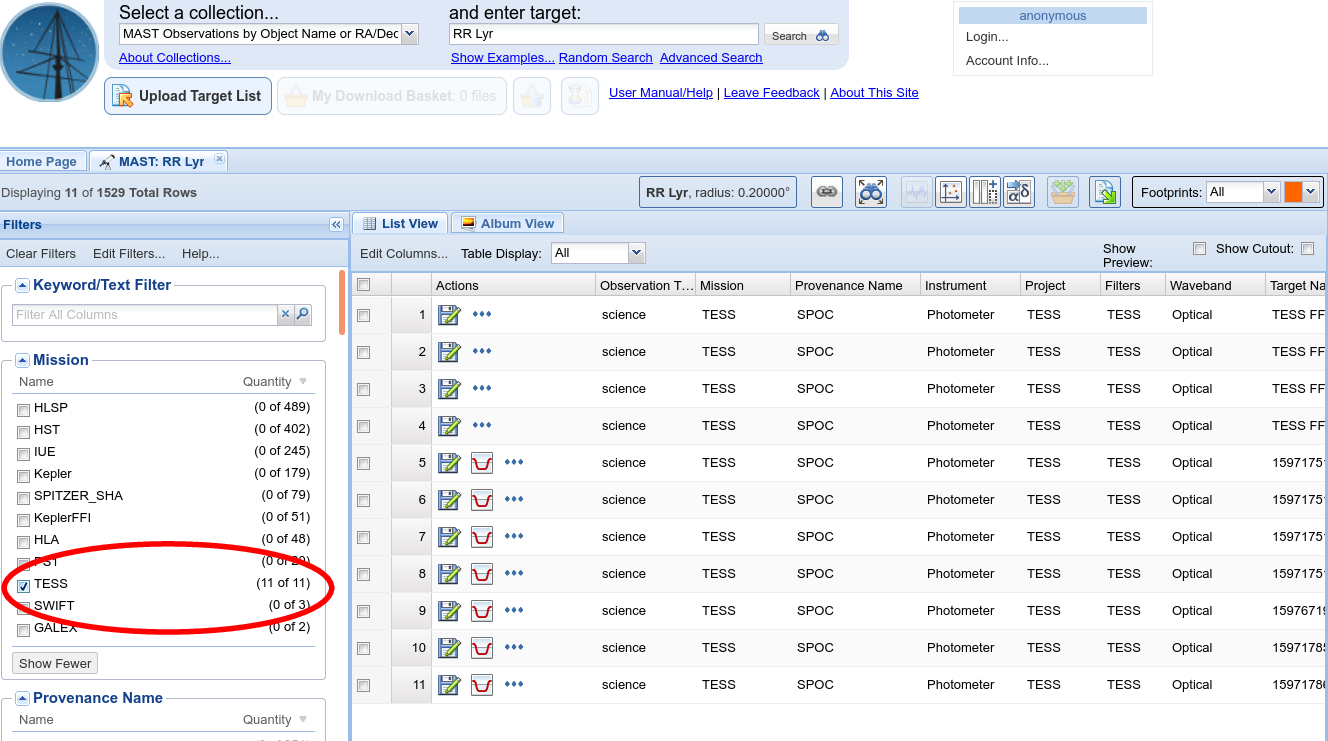
A list of missions with data on the target will be shown. Check the box next to "TESS", and the site should show a list of measurements made by the TESS satellite.
Look for entries in the "List View" tab which contain icons of a red transit-like light curve. Clicking on each of these icons will pop up a new window with either
If you see the error message, try a different entry in the list.
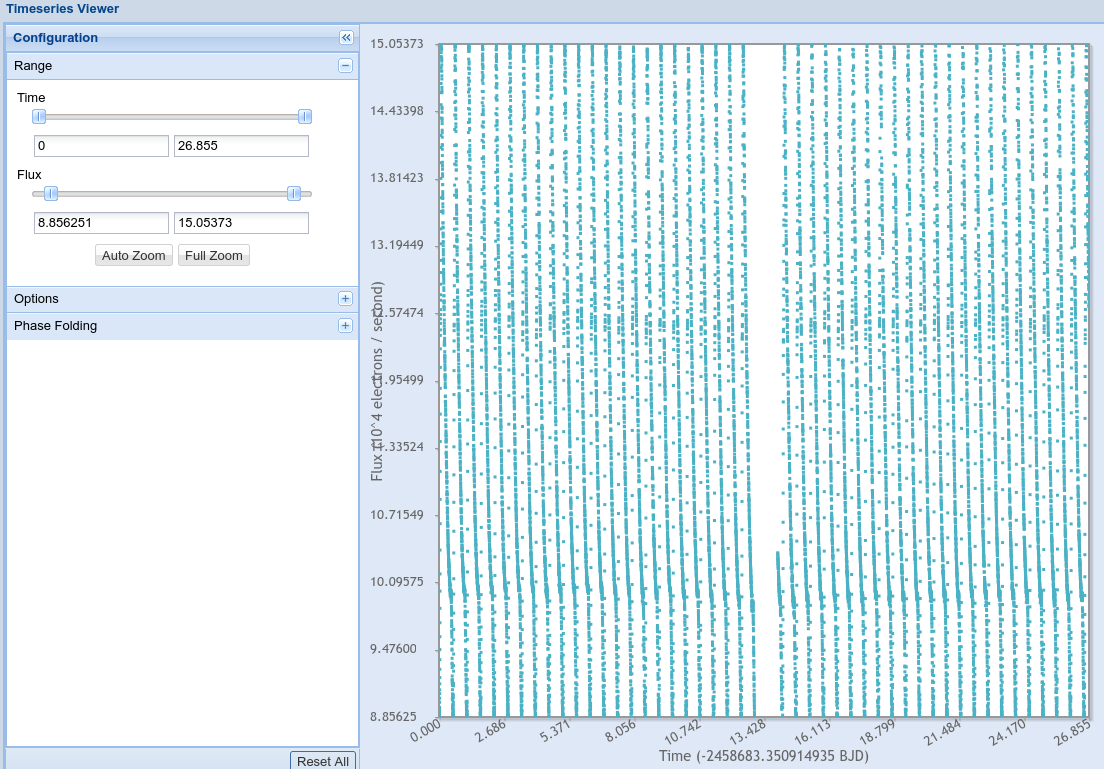
A good entry will return either a "good" set of measurements, which will show a nice, clean light curve like this ...
... or, sometimes, a strange, "bad" curve with lots of noise and no obvious periodicity, like this:
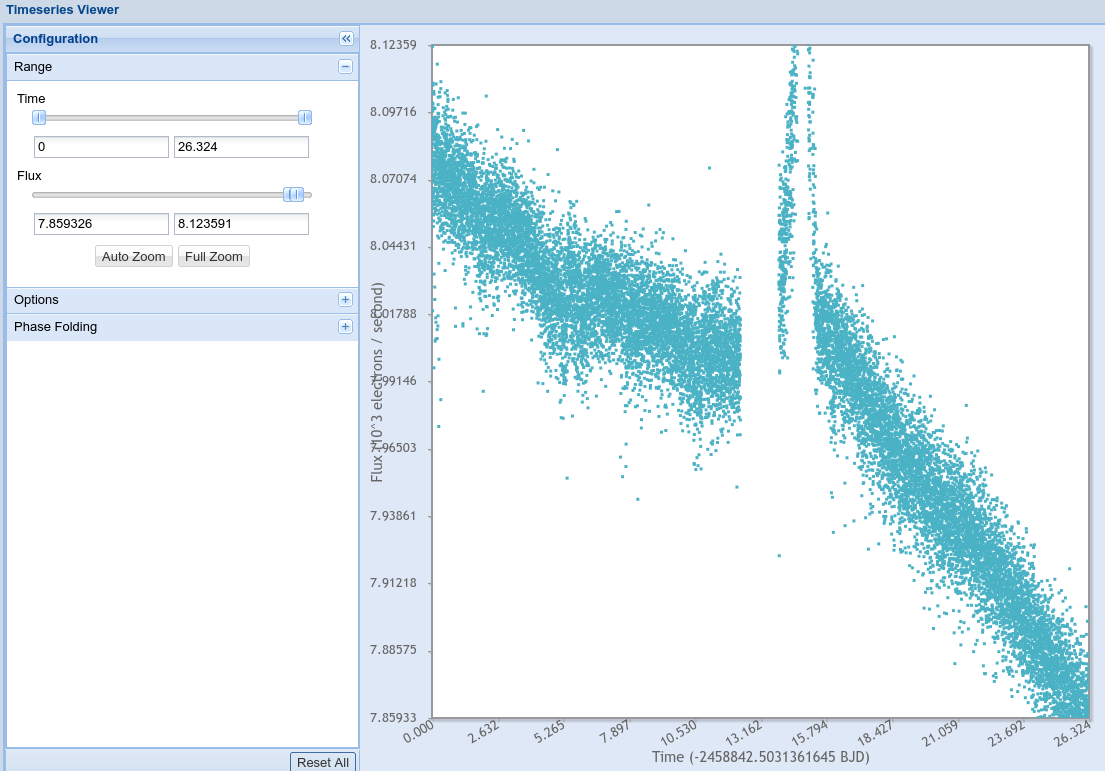
If you see something like the "bad" curve, try a different entry in the list. I'm not sure exactly what causes these "bad" curves, but they probably won't help your analysis.
If you can't find a "good" light curve in any of the TESS entries, then you'll have to give up on TESS and try a different source of measurements.
So, let's assume you were able to find a "good" light curve entry. You can use the interactive controls in the "Timeseries Viewer" window to modify the graph, zoom in or out, and even try folding the light curve with a period of your choice to see how it looks. That's fine -- play with it and have fun. If you want to download the measurements for further analysis on your own, you can ... but the format isn't so easy to access. Let me show you a method by which you can convert the measurements into a CSV file which can be read by any spreadsheet or simple program.
First, download the TESS data onto your computer by clicking on the floppy-disk icon next to the entry in the "List View" window. A single file in ZIP archive format will be transferred to your computer.
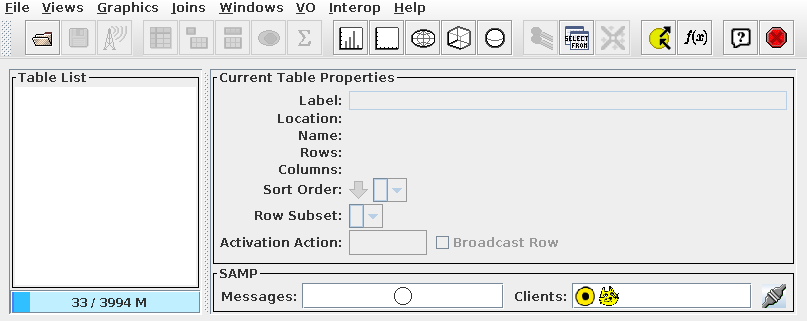
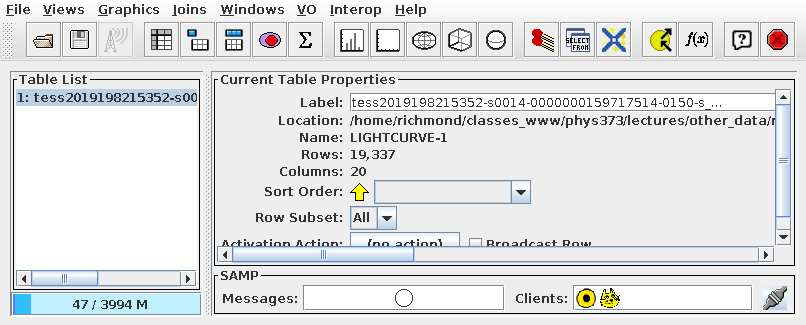
Next, extract all the files from this ZIP archive. There will be a number of folders and sub-folders. Look in a folder called "TESS" for sub-folders; inside those sub-folders should be a file with a name ending with -s_lc.fits. This file has a special format called "FITS Table". In order to convert it into a simple CSV format, we will use a piece of software called TOPCAT.
Tool for OPerations on Catalogues And Tables (TOPCAT) is a wonderful tool which runs on multiple platforms and is available for free. Hooray! It can perform many, many different and complex tasks, but we will use it to do one simple job: converting our FITS table into a different format. Here's what you need to do:
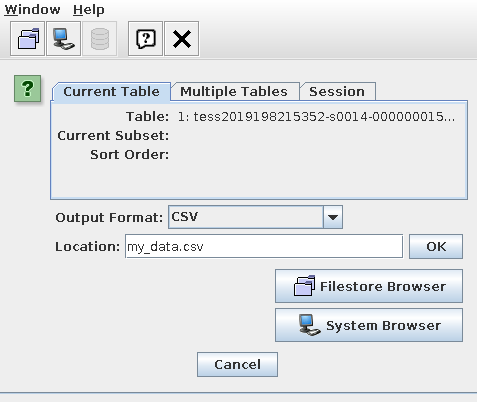
Voila! You can now access the data using a spreadsheet, or any other program.
The All-Sky Automated Survey for SuperNovae (ASAS-SN) is an international collaboration which uses telescopes in Texas, South Africa, Chile, and Hawaii to scan the skies frequently. The main goals of the project are to study objects which vary in brightness: ordinary variable stars like those we are observing, but also such exotica as supernovae and microlensing events. The group very kindly makes their observations freely available to astronomers everywhere. Perhaps you'll find some measurements of your star in their databases.
To begin, go to their main archive interface at
Type the name of your star into the "ASAS-SN or Other name" box, and click on "Search."
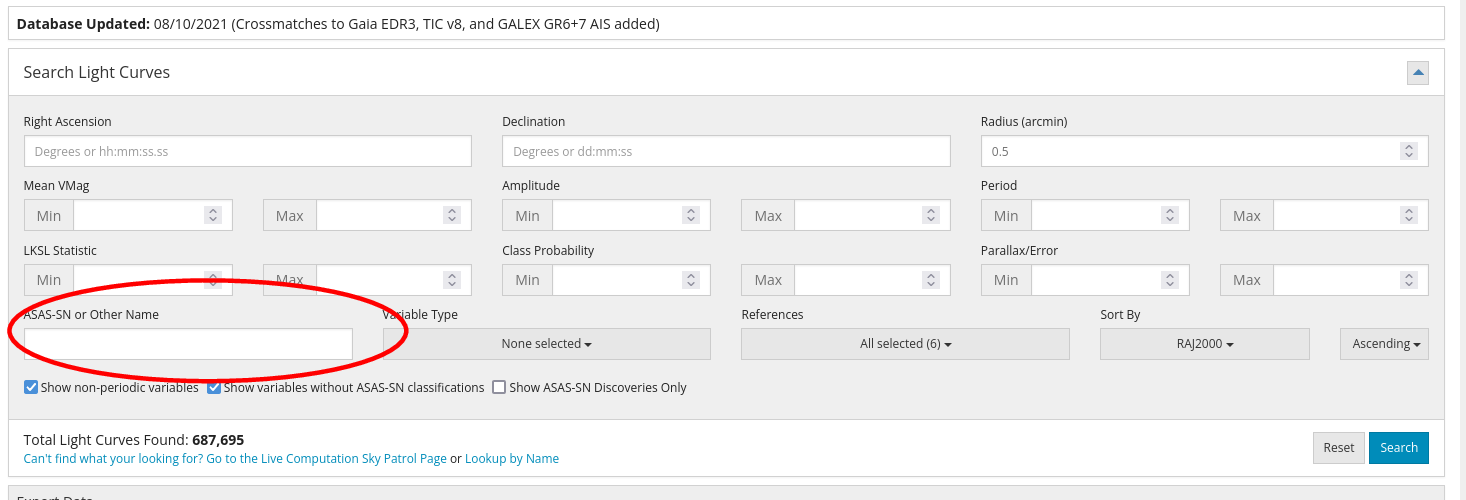
If your star isn't found, well, that's all she wrote. You'll have to try a different archive.
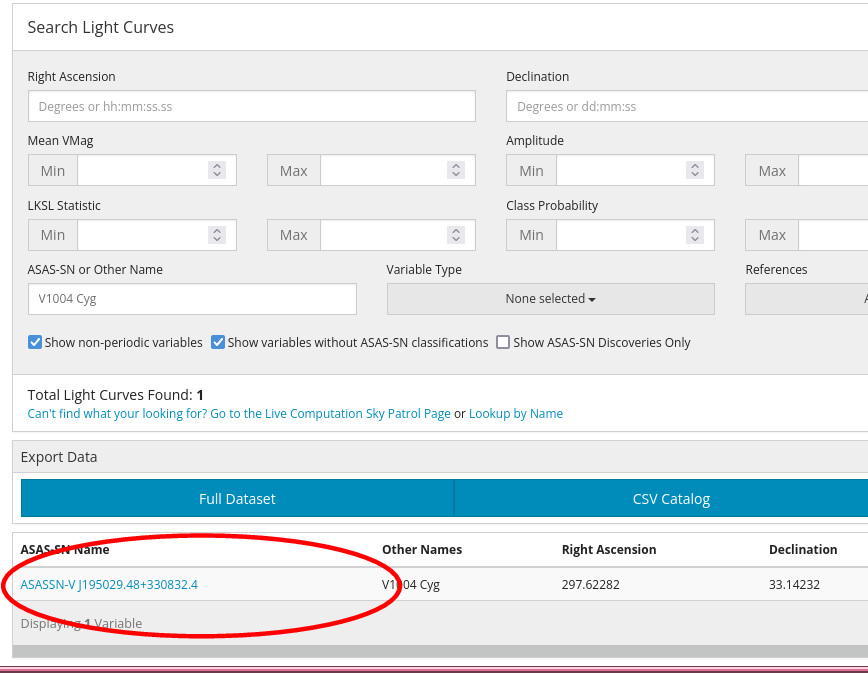
But if the star does exist in the database, you'll see a link to it near the bottom of the window. Click on this link.
You should see a page full of information on your star. A small finding chart is at right, while a graph showing the light curve should appear near the center. You can play with the buttons to modify the period, if you wish.
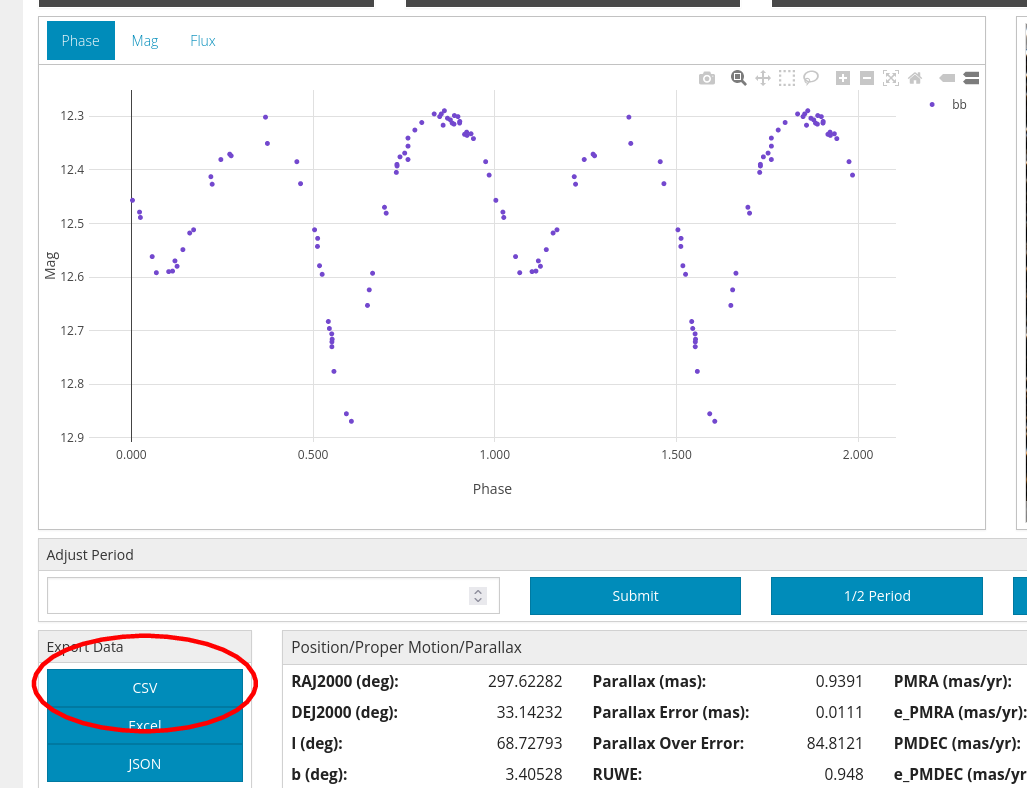
By clicking on the "CSV" or "Excel" buttons below the light curve, you can download a datafile containing the measurements made by ASAS-SN. In the case shown here, the first few lines of the CSV file look like this:
id,star_id,hjd,camera,mag,mag_err,flux,flux_err,created_at,updated_at
014e88c8-27c2-55ad-86cd-41bb7446a73c,c8299b6e-fac6-5dd2-a966-1fa10dcc129d,2457103.11138,bb,12.592,0.02,35.257,0.649,2019-04-16 16:32:04 UTC,2019-04-16 16:32:04 UTC
05aa6d0e-a5b9-5288-9d05-b073586cd965,c8299b6e-fac6-5dd2-a966-1fa10dcc129d,2457166.98576,bb,12.427,0.02,41.02,0.755,2019-04-16 16:32:29 UTC,2019-04-16 16:32:29 UTC
07d83228-5bba-58cd-a58a-31e161be0764,c8299b6e-fac6-5dd2-a966-1fa10dcc129d,2457658.78398,bb,12.385,0.02,42.657,0.785,2019-04-16 16:32:36 UTC,2019-04-16 16:32:36 UTC
Let me replace the commas with spaces, to make it a bit easier to read. I'll also shift the labels on the first line to line up with the data in each column.
# id                                               star_id                       hjd     camera  mag  mag_err  flux  flux_err      created_at               updated_at
014e88c8-27c2-55ad-86cd-41bb7446a73c  c8299b6e-fac6-5dd2-a966-1fa10dcc129d  2457103.11138  bb  12.592  0.02   35.257  0.649  2019-04-16 16:32:04 UTC  2019-04-16 16:32:04 UTC
05aa6d0e-a5b9-5288-9d05-b073586cd965  c8299b6e-fac6-5dd2-a966-1fa10dcc129d  2457166.98576  bb  12.427  0.02   41.02   0.755  2019-04-16 16:32:29 UTC  2019-04-16 16:32:29 UTC
07d83228-5bba-58cd-a58a-31e161be0764  c8299b6e-fac6-5dd2-a966-1fa10dcc129d  2457658.78398  bb  12.385  0.02   42.657  0.785  2019-04-16 16:32:36 UTC  2019-04-16 16:32:36 UTC
The most useful columns here are probably the "hjd" and "mag" values. The "camera" column records which of the many ASAS-SN cameras made the given observation. Camera codes "ba" to "bh" correspond to V-band magnitudes, while codes "bi" to "bt" measured g-band (similar to B-band) magnitudes.
Copyright © Michael Richmond.
This work is licensed under a Creative Commons License.