 Copyright © Michael Richmond.
This work is licensed under a Creative Commons License.
Copyright © Michael Richmond.
This work is licensed under a Creative Commons License.
Each team must create three finding charts, showing the location of their target in the sky. You must have both electronic and paper copies of all three charts when you are ready to go to the Observatory to acquire images of your target. The charts are:
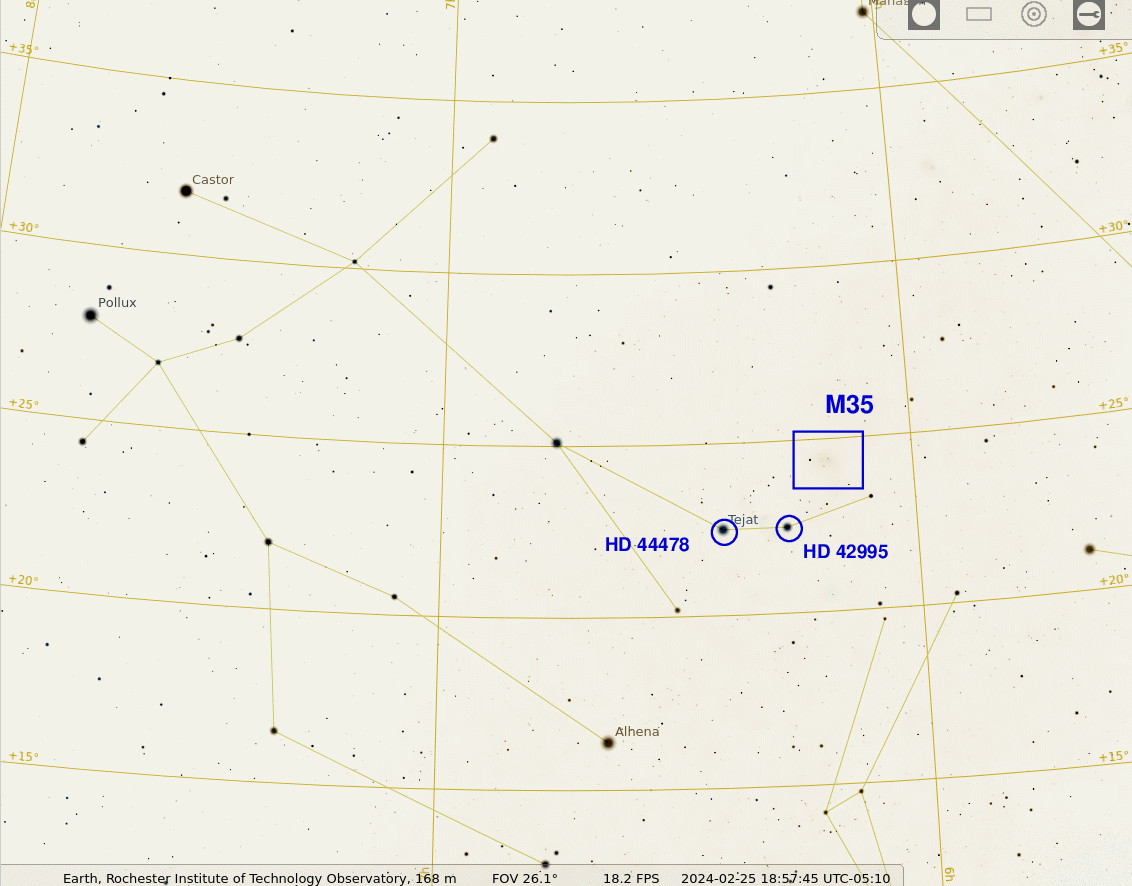
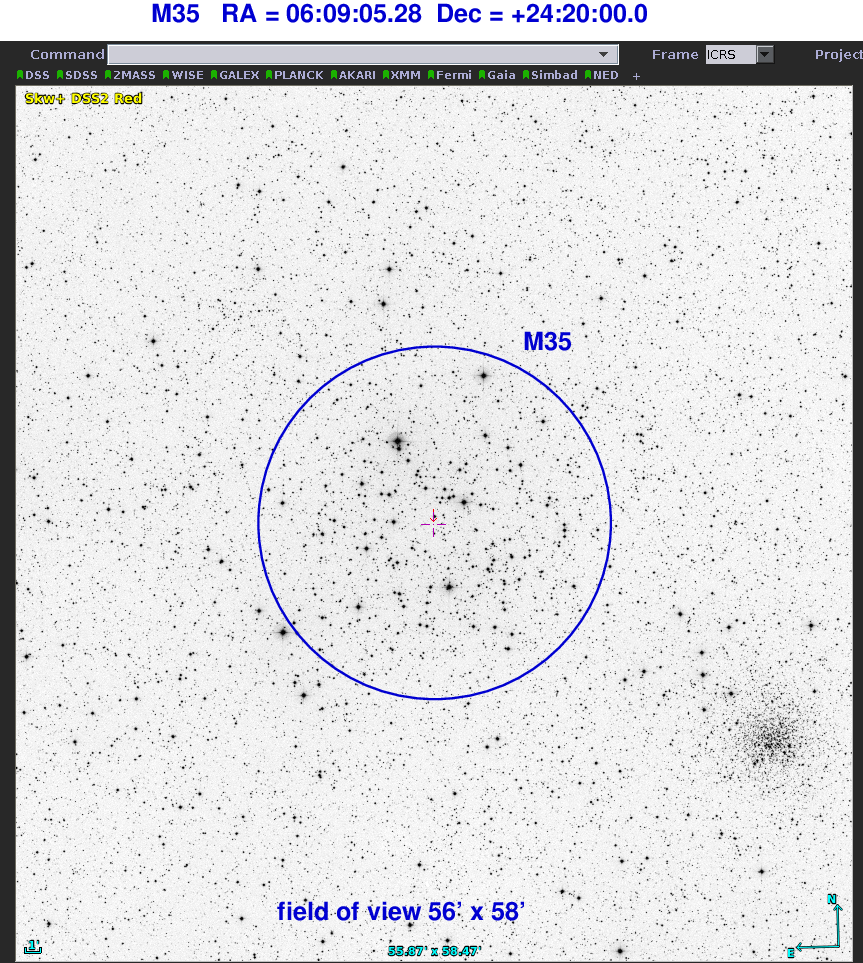
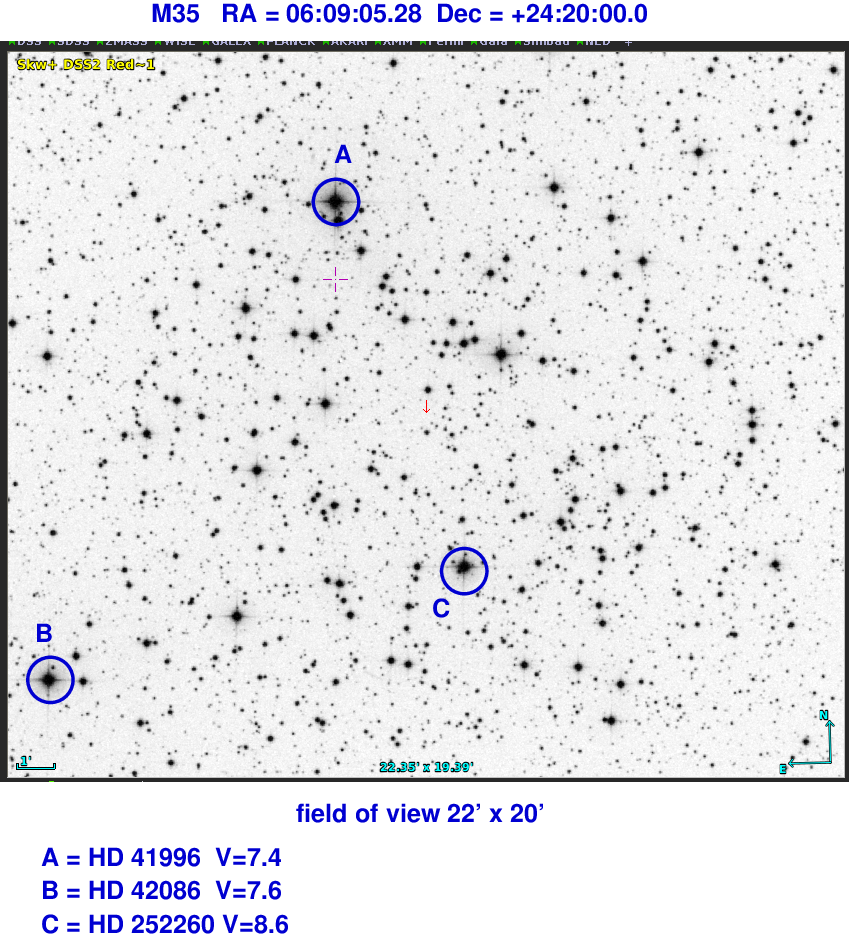
To illustrate the nature of each of these charts, I'll adopt as my own target the open cluster M35.
The first chart should show a large enough section of the sky in Stellarium that you can identify very bright stars and prominent constellations. The chart should be made in "equatorial" orientation (click on the telescope icon at bottom of screen) so that North is up and East is to the left. Label the location of your target clearly. Choose several bright-ish stars which are within 3-5 degrees of your target, and write their Henry Draper (HD) numbers on the chart as well. Stellarium will provide that information.
The next two charts will be based on the Digitized Sky Survey 2 Red (DSS2 Red) photographic plates, which can be examined within the Aladin program. The first chart should be centered on your target and about 1x1 degree in size; North should be up and East to the left. The target should be clearly identified and labelled; if there are any bright stars in the field, label and identify the brightest one or two of them. Be sure to write the name, RA, and Dec of the target in big letters at the top (or bottom) of the chart. Somewhere on the chart, write the size of the field of view clearly.
The final chart should be taken again from the DSS2 Red survey, but should be smaller: only 0.4 x 0.4 degrees. On this chart, again write the name, RA, and Dec of the target at the top (or bottom). Label and identify your target (I haven't done so in the chart below because the cluster of stars pretty much fills the field). Also label and identify two or three of the brightest stars in the field, and provide a rough value for their magnitudes.
When should you plan on going out to the Observatory to make measurements of your object? It can help if you have a general idea of the times during the night when you object is first visible at least 30 degrees above the horizon, and when it is last visible 30 degrees above the horizon.
For the "starting time," figure out which of the following two is LATER:
Enter the later of those two times into the first column of the table below.
For the "ending time," figure out which of the following two is EARLIER:
Enter the earlier of those two times into the second column of the table below.
Don't use Universal Time in the table; instead, write times in ordinary civil time for the Eastern time zone. Use "PM" and "AM" in the table. Why? Because it's a lot simpler to understand a time like "3:30 AM" when you are very tired than it is to start with "UT 08:30" and try to convert it to a time you can compare to the clock on the wall or your cell phone.
   Date      start observing (PM/AM)          end observing (PM/AM)
----------------------------------------------------------------------
  Mar 1

  Mar 15

----------------------------------------------------------------------
  Apr 1

  Apr 15
----------------------------------------------------------------------
Copyright © Michael Richmond.
This work is licensed under a Creative Commons License.