 Copyright © Michael Richmond.
This work is licensed under a Creative Commons License.
Copyright © Michael Richmond.
This work is licensed under a Creative Commons License.
Today's lab exercise should be carried out in pairs, ideally, but it's okay to do it by yourself or in a group of three.
In order to gain credit for this exercise, you must create a PDF document which provides the answers to all the questions. Submit the PDF to the instructor via the "Assignments" tab in myCourses.
You have probably taken photographs and pictures with a camera or your smartphone or some other device. There are plenty of software packages designed to display digital images, and to modify them in many different ways. You've undoubtedly heard of Photoshop and similar programs.
Why not use such programs to display and process astronomical images, you might ask. Well, one problem is that astronomers are sometimes interested in examining their images in rather peculiar ways -- not exactly the same way that most people like to process their snapshots of grandma's birthday party. Another problem is history: long ago, back in the 1980s, astronomers settled on a particular format for storing their digital images.
This is the format that the cameras at the RIT Observatory will produce, and which you will acquire during your nights at the Observatory. Although some ordinary image-processing packages will read and write FITS images, most scientists use special-purpose software which is specially designed to perform astronomical tasks -- such as finding stars and measuring their brightness.
In order to take advantage of these dedicated astronomical routines, we will adopt one of the special software packages written by and for astronomers:
This software has already been installed on the computers in the Gosnell computer classroom. If you wish to use it on your own laptop or desktop, you will have to install it on your machine. The package is free of charge; just choose the appropriate item from the AIJ downloads page , unpack, and follow the instructions.
One warning: there are several different versions of AIJ available, and it's especially common to run into different versions on different platforms. If you are running both on, say, Windows and MacOS, then check carefully to see if you are using the same version on both.
The images we will use today were taken at the RIT Observatory back in 2011. Please download all of these onto your local computer as a first step.
(One of these was omitted from an earlier version of this exercise -- sorry!)
Okay, let's try to read in just one of these images and verify that it looks proper. We'll start with the image from August 28:
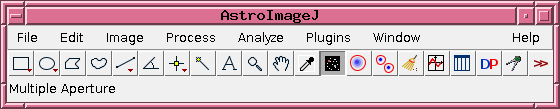
Start running AIJ. A new window should appear, which looks something like this:
From the "File" menu, navigate to the directory holding the images you just downloaded, and choose the one called "m101r_aug28_-002R.fit". The image should appear within a new AIJ window, and look something like this:

Just when was this image taken? How long was the exposure time? What sort of instruments were used? These are all good questions that can enhance the scientific information in an astronomical image.
For that reason, the creators of the FITS datafile format incorporated a mechanism to keep such useful information together with the pixels of the image itself. A (simple) FITS image contains two sections:
AIJ will allow you to examine the contents of the FITS header. After you've loaded an image, click on the spreadsheet-like icon
AIJ will open a new window with the contents of the header.

AIJ does its best to set the contrast of an image to reasonable values, but it may fail for some images. There may be times when you want to modify the settings in order to emphasize some particular feature. There are several ways to modify the appearance of an image in the AIJ window.
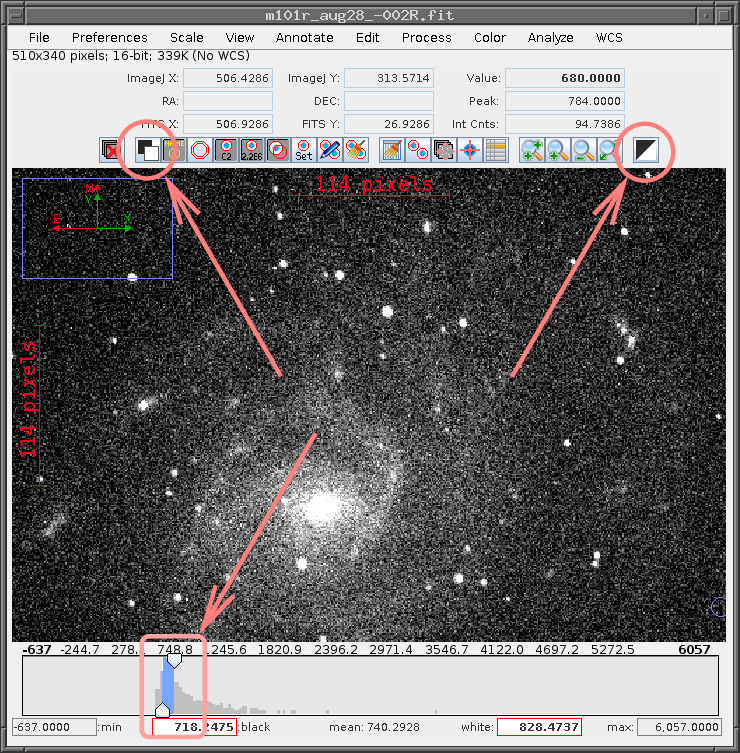
The icon highlighted at upper-left inverts the colormap.
The sliders at the bottom of the image will set the pixel values corresponding to pure black and pure white; values between these two extremes will be some share of gray. One can also type numbers for these extremes into the boxes just below the sliders.
The icon highlighted at upper-right restores the color map to its default value.
The standard in astronomy is to display images so that North points up, and East points to the left. This is OPPOSITE to the normal convention on maps, which place North up and East to the right.
By default, these images will not have the standard orientation on your screen. Your job is to modify them so that they do. Here's how.
First, use Aladin to make a finding chart of the galaxy called "M101". Choose a field size of 0.5 degrees, and (if you wish) pick the "DSS2 Red" survey. This chart will have the standard format: North up, East left -- just look at the little axes in the lower-right corner of the chart.
Arrange your windows so that you can see both the Aladin view and the AIJ window at the same time. You will notice that the two images are not oriented in the same way.
Choose the "View" menu item at the top of the image window. You'll see a number of choices involving various inversions. Find the choice(s) which cause the AIJ image to match the Aladin image.
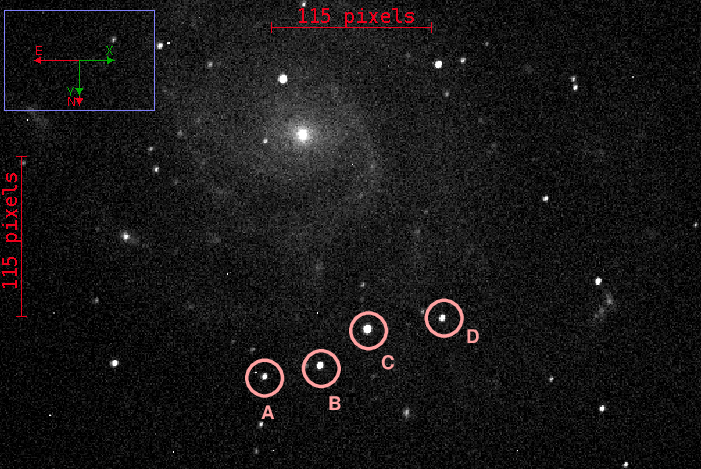
All the images today contain the central regions of the galaxy M101, as well as some stars surrounding it. We'll be measuring four stars in particular which are located just south of the center of this galaxy.
    Star              RA             Dec            r'-mag
----------------------------------------------------------------
     A

     B

     C

     D
----------------------------------------------------------------
Two important properties of any astronomical image are the image size -- how large an area does it show? -- and the image scale -- how large is one individual pixel of the image? The usual convention is to describe the size in either degrees or arcminutes (example: "this image is 30 by 24 arcminutes in size") and the scale in arcseconds per pixel (example: "each pixel subtends 1.4 arcseconds").
Let's figure out the size and scale of the image you have been displaying. One handy method involves the dist tool in Aladin.

If you click on this icon, the cursor will change color. Now, move to a star (or other point of interest) in the Aladin image, and click-and-hold the left mouse button. Now drag the mouse to another star (or point of interest). You'll see a line appear, following the pointer. When you release the mouse button, the line will remain on your screen. You can read the angular length of the line from the label on it. For example, a label of 9.700' indicates an angular size of 9.7 arcminutes. Since 1 arcminute = 60 arcseconds, this is equivalent to an angle of 582 arcseconds.
A good way to measure the pixel scale of an image is to choose two stars that you can identify clearly in both the Aladin image, and the CCD image in AstroImageJ. Pick two stars that aren't too close to each other. First, measure the angular size between them using Aladin's dist function. Write it down, and convert to arcseconds. Then, measure the (x, y) coordinates of each star in AIJ. Write those pixel coordinates down, and then use the Pythagorean theorem to calculate the distance between the two stars in pixels. Finally, divide the distance in arcseconds (from Aladin) by the distance in pixels (from AIJ), and Bob's your uncle.
One of the stars in this set of four is doing something unusual: changing in brightness by a significant amount. Your next task is to figure out which star it is, and to make a qualitative description of its variation.
A very handy feature of AIJ is its ability to open, not just one image, but a whole "stack" of images at once. Once you've opened a set of images in a "stack", you can quickly move from one image to the next, and apply a set of commands to the entire group. It's not necessary to use a "stack" for this exercise -- you can certainly open each file in its own image window if you wish -- but it might be convenient.
As a first step, please create a new folder on your computer and copy into this new folder each of the eight FITS images with names starting with m101r_.
In order to open a set of images in a "stack", first, open just one image in a window by itself. Then, go to the menu of commands for that one image window, and choose "File -> Open Image Sequence in New Window". You'll be shown a new menu. Choose the new folder you created which contains only those eight images, and click on "OK". A new window should appear, containing the image of the first image in that set. Along the bottom of this window is a slider bar. By moving this slider left or right, you will be able to display the various images in the stack. Try it.
You may need to modify the contrast settings for one image -- but if you do, those same settings will be applied to all the images. It may be slightly annoying, but do the best you can.
Make a list of the images in chronological order -- that may be different than the order in which they appear in the stack. In order to answer the questions below properly, you will need to estimate the change in brightness of the variable star over time, from earliest to latest.
Later on in this course, you'll find out how to use AIJ's full capabilities in order to measure stellar brightness most accurately and efficiently. Today, we're going to do a very simple, and not-so-accurate type of measurement. Still, it will serve the purpose.
Choose a star in the image. Move your cursor to the star; you should see a little blue circle follow your cursor as you move across the image. In the upper-right corner of the image display window, you'll see a box labelled "Value", and another box labelled "Peak". The value of the brightest pixel inside the blue circle will be shown in the "Peak" entry. That can stand for the brightness of the star (in a very rough way). A star with a peak of 2500 counts ought to be about twice as bright as a star with a peak of 1200 counts.
So, go through each of the eight images. Measure the peak brightness of each star -- A, B, C, D -- in each image.
                                      peak intensity
 Image    JD - 2,455,000          A          B         C         D
----------------------------------------------------------------------

aug25

aug28

sep03

sep10

sep18

oct23

nov24

jan06

---------------------------------------------------------------
You can now convert the peak intensity values for each star into relative magnitudes. Pick one of the not-variable stars as a reference star, and use it as the basis for the formula

Calculate relative magnitudes for each of the stars, and fill in the table below.
                                      relative magnitude
 Image    JD - 2,455,000          A          B         C         D
----------------------------------------------------------------------

aug25

aug28

sep03

sep10

sep18

oct23

nov24

jan06

---------------------------------------------------------------
Now you can make a light curve, placing the Julian Date (- 2,455,000) on the horizontal axis, and the relative magnitude on the vertical axis. If all went well, the meausurements of the three comparison stars should be roughly horizontal, but the variable star should ... change quite a bit.
Clearly, one of these stars is very wierd. Put on your Sherlock Holmes deerstalker cap and start investigating. Can you figure out the identity of this star? Just why was it changing so much?
You may have noticed that the very first image in this set looks ... rather strange. You may recall that astronomers cool their cameras to very low temperatures to reduce the electronic noise. Well, if the camera is cooled to below the freezing point of water, and if there is any moisture inside the camera, then ... ice crystals can form on the electronic sensor, or on the glass window just in front of it. That's what happened on this particular night.
Under ordinary circumstances, one would throw such images away; the measurements of stellar brightness might be affected by the crystals, after all. But we have chosen to keep this image in this exercise; and, it turns out, I decided to keep the measurements from this image (and others like it on the same night) in the dataset which I reported to other astronomers.
Copyright © Michael Richmond.
This work is licensed under a Creative Commons License.