 Copyright © Michael Richmond.
This work is licensed under a Creative Commons License.
Copyright © Michael Richmond.
This work is licensed under a Creative Commons License.
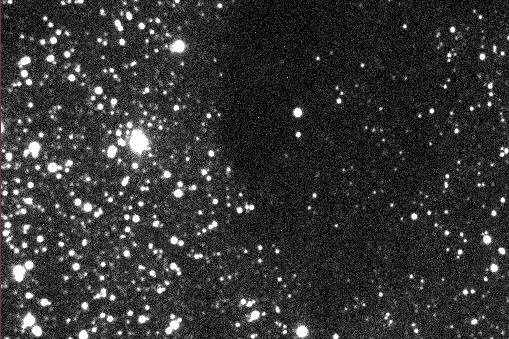
There are times when it would be nice to know the general background level in an image. For example, suppose that we want to look for stars. One good definition a star is
  star:  a clump of pixels which are all significantly
         above the background level


        Q:  Why "clump of pixels"  instead of a single pixel?


        Q:  What does "significantly" mean?
So, how can we determine
We could just compute the mean and standard deviation of all pixel values, but that would give us a poor estimate if there were lots of outlier pixel values. And, surprise!, in real images of the sky, there ARE lots of outlying high pixel values. So, we need a better technique.
One method is to create a histogram of pixel values. You can do that with the hist command, like so:
hist foo.fit
Running this command should cause a number of lines to be printed to the screen,
Mean  adus     307.38
Total adus 307375075.000000
Max.  adus   31296 at row= 292  col=227
Min.  adus       3 at row= 194  col= 87
Total     pixels 1000000.000000
Overflow  pixels          0
Underflow pixels          0
Standard deviation =     580.64
Median        206  adus
Mode          198  adus
and it should also create a new text file. The file will have the same name as the FITS image, but the extension part of the name will be changed to .his, like this: foo.fit turns into foo.his.
This file contains three columns of numbers:
       0                0 0.000
       2                0 0.000
       3                1 0.000
       4                0 0.000
       6                0 0.000
       7                1 0.000
  Exercise: Place a copy of the image "$dd/pluto_021.fits"
                   into your own directory.  Display the image.
                   Use the hist program to make a
                   histogram data file.

                   What is the most commonly occuring pixel value?

                   What is the median pixel value?  (That is, the
                   value which is in the middle -- half of the pixels
                   should be smaller, half should be larger)
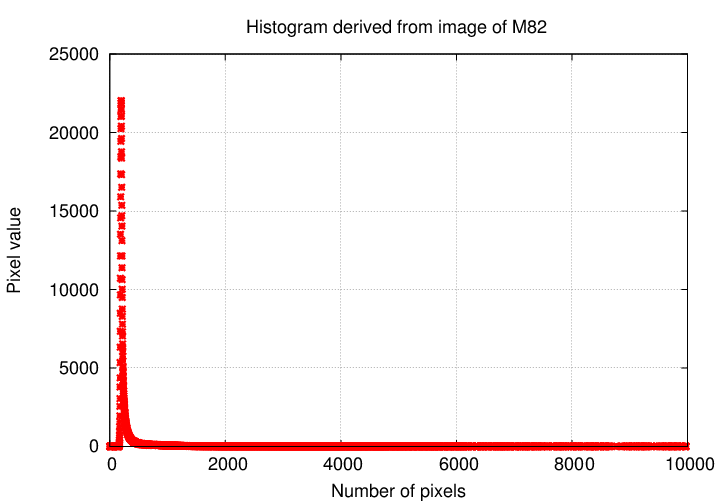
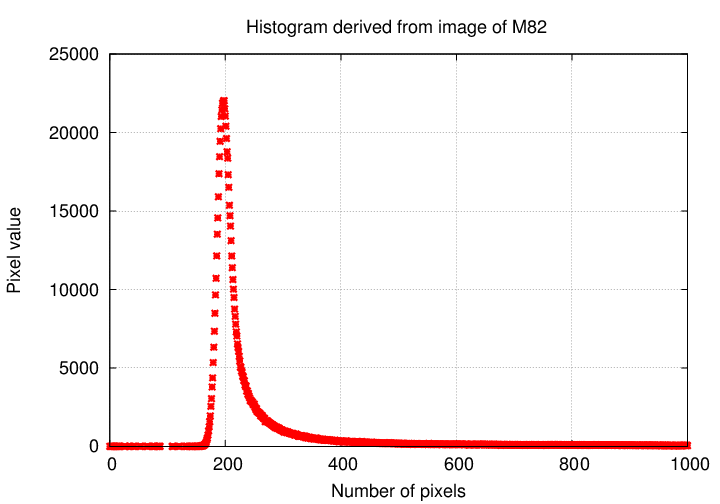
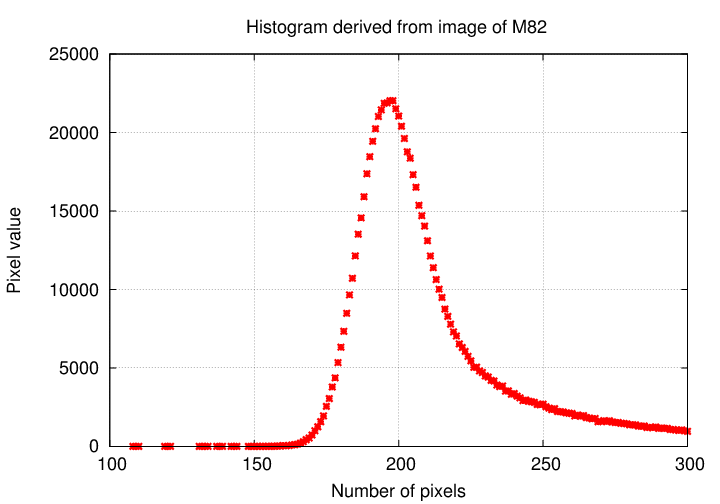
If you make a graph which plots the number of pixels on the y-axis, and the pixel value on the x-axis, you'll make a histogram:
  Exercise: Make a graph showing the histogram of pixel
                   values in the image pluto_021.fits.


                   Use your graph to estimate the typical background value.


                   Use your graph to estimate the variation in the
                   background value.
Making a histogram can tell you a lot about an image. If there are wierd noise properties, or if the background suffers from some defect, the histogram might show it. On the other hand, making a histogram takes a lot of time. Is there a faster way?
Yes. The XVISTA program called sky will
  Exercise: Use the sky program to compute the typical
                   sky value, and its uncertainty, for the image pluto_021.fits.

                   How do these values compare to your earlier estimates?
So, what can you do once you know the sky value?
Well, one thing you can do is to look for objects which have pixel values significantly higher than the typical background level. In other words, you can look for stars and galaxies.
The XVISTA program stars will go through an image, pixel-by-pixel, looking for bunches of pixels which are all above some particular value. It will report the locations and shapes and heights of any bunches it finds. But -- in order for it to work properly, you need to give it some information: the typical sky level, and the number-of-standard-deviations-above-typical-sky that a real object much reach.
For example, if you want to find only really, really bright objects, you might include only objects which have peak values at least fifty sigma , or 50 σ, above the typical background level. That means
peak pixel must be > (typical sky level) + 50*(variation in sky)
Ypu could run the program on the pluto_021.fit image like so:
             stars  pluto_021.fit  sky=xxx skysig=yyy  minsig=50

   where

                   xxx       is the typical sky value

                   yyy       is the uncertainty in the sky value
So, your turn: find out how many stars are in this image which are really, really bright: at least 50 times the variation in the sky level. Then, try again with a much lower level of significance, say, 5 times.
  Exercise: How many stars are in the image pluto_021.fits
            with peak values more than 50-sigma above the sky level?

                        Check two or three of the stars which appear
                        in the output list.  Are they all real stars?


            How many more than 5-sigma above the sky level?

                        Check two or three of the stars which appear
                        in the output list.  Are they all real stars?
Copyright © Michael Richmond.
This work is licensed under a Creative Commons License.